Experimental Research Promotion System Diagram
RJ0700026_5
- Last Update 07/29/2025
- File Size 0.6MB
- # of Slides 2
- File Format PPTX
- Slide Ratio 16:9
- Color
Keywords
- #Content-Based Slides
- #Design-Based Slides
- #Product/Service Introduction
- #Business Strategy
- #Diagram
- #Differentiation Strategy for Products/Services
- #Implementation Framework
- #Flow
- #Linear Flow
- #16:9
- #linear diagram PowerPoint slide
- #3-step process flow
- #experimental research presentation
- #research workflow diagram
- #arrow flowchart PPT template
About the Product
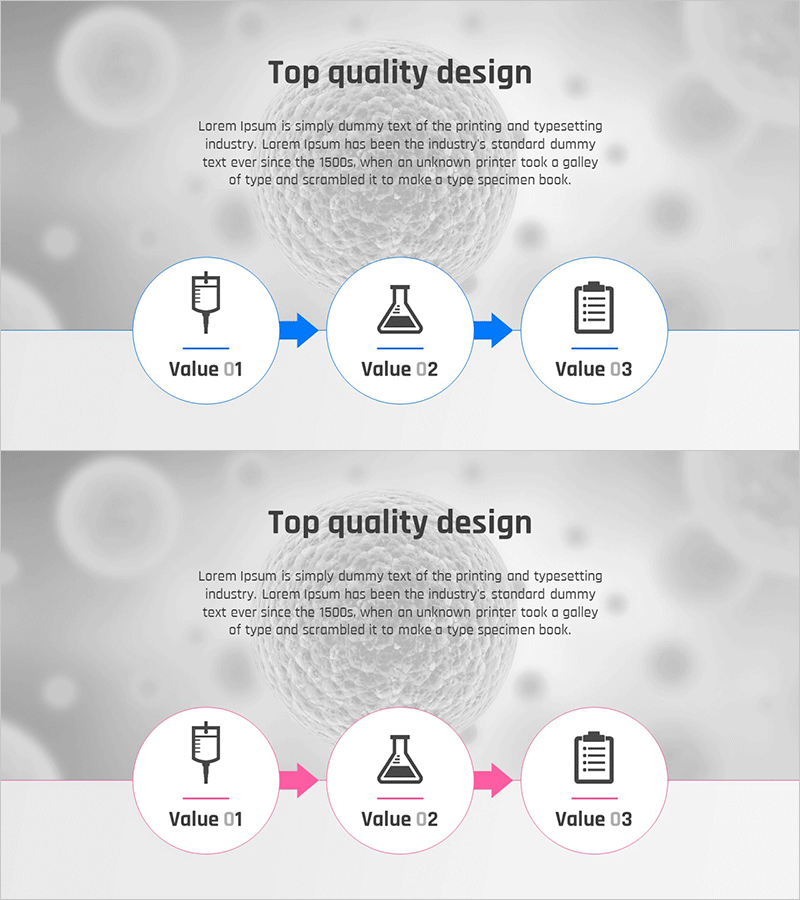
A linear diagram PowerPoint slide that visualizes the experimental research promotion process in three sequential stages. Circular nodes featuring syringe, flask, and clipboard icons are connected by directional arrows to clearly represent the workflow progression. Available in two color versions—blue-toned and pink-toned—allowing you to match your presentation theme and audience context. This 16:9 widescreen 2-slide deck is fully editable and ready to use immediately in your research presentations.
Usage Points
-
Main Usage
Designed to visually explain the phased progression of experimental research projects. The three-stage flow—syringe (preparation) → flask (execution) → clipboard (completion)—uses icons and arrows to enhance audience comprehension of research methodology.
-
How to Use
Ideal for research proposal presentations, laboratory operations briefings, project kickoff meetings, and academic seminars. The blue version conveys formality and professionalism, while the pink version creates a more creative and dynamic atmosphere. Select the version that best matches your audience and presentation context.
-
Recommended For
Recommended for university research teams, scientific institutions, R&D departments, medical research facilities, and technology development teams. Suitable for student thesis presentations, research grant applications, technology transfer briefings, and laboratory management discussions.
-
Slide Structure
Two-slide deck featuring three circular nodes with icons connected by left-to-right directional arrows. The first slide uses blue-toned arrows and node borders, while the second slide repeats the identical structure in pink tones, providing flexible color options for different presentation needs.
Related Products
-

Camera Aperture Diagram – The Beginning of Entry
#Business Strategy #Operational Plan #Diagram
-

Differentiated Promotion Strategy Presentation Template – Emphasizing Marketing and Innovation
#Product/Service Introduction #Marketing Plan and Strategy #Diagram
-

Colors Theme Presentation Template Sequence Diagram – Ideal for Business Execution Strategy
#Business Strategy #Business Management #Diagram
-

Blue Line Wide Template Directional Diagram2 – Visual Flow and Effective Communication
#Product/Service Introduction #Operational Plan #Diagram
