Science Experiment Plan Diagram – Step-by-Step Implementation System
RJ0700026_17
- Last Update 07/29/2025
- File Size 0.2MB
- # of Slides 2
- File Format PPTX
- Slide Ratio 16:9
- Color
Keywords
- #Content-Based Slides
- #Design-Based Slides
- #Business Strategy
- #Diagram
- #Step-by-Step Schedule Plan
- #Implementation Framework
- #Flow
- #Cluster
- #Linear Flow
- #Chain Diagram
- #16:9
- #4-step diagram PowerPoint
- #linear connection slide template
- #step-by-step process diagram
- #business strategy PPT
- #how to create process diagram in PowerPoint
About the Product
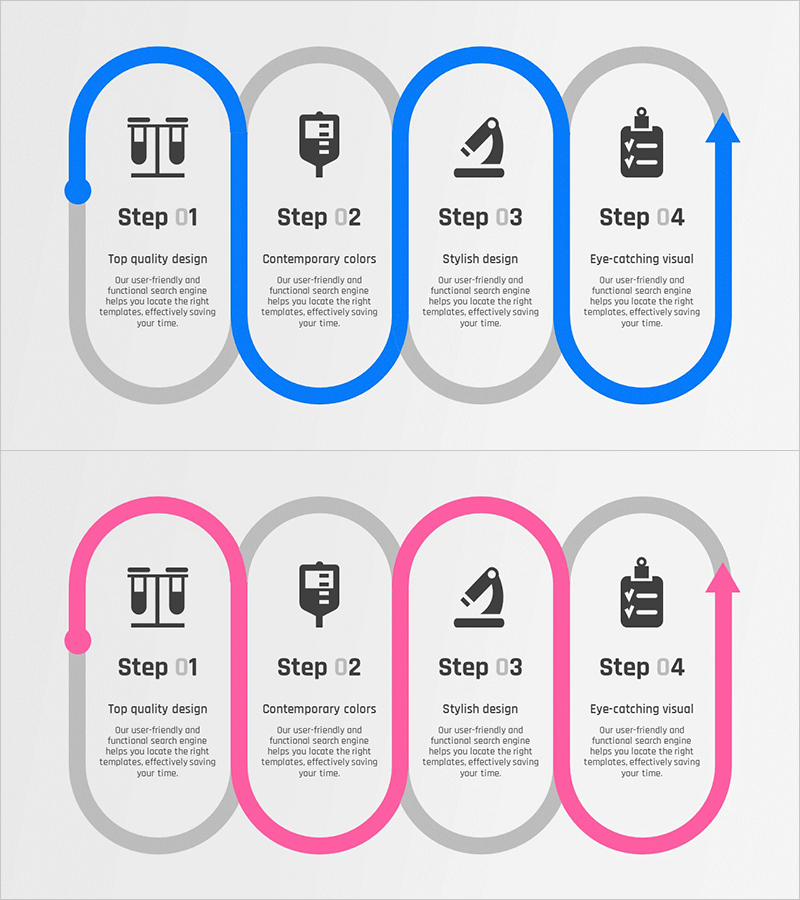
A linear connection diagram PowerPoint slide that sequentially links four stages with icons and text areas for each step. The blue and pink dual-tone accent lines visually convey relationships between stages, while gray supporting lines add structural stability. This slide template is ready to use for business strategy presentations, scientific experiment planning, project timeline management, and various other presentation contexts. Each node features clear icon placement and descriptive text fields for comprehensive process communication.
Usage Points
-
Main Usage
Optimized for visually expressing four sequential stages or timelines. Each stage's key content is clearly communicated through icons and text, with connecting lines emphasizing relationships between stages. Suitable for business strategy presentations, project timelines, experiment planning, educational curricula, and various other presentation contexts.
-
How to Use
Enter stage titles and descriptions in each node's text area. Replace icons with images representing each stage's characteristics. Select either blue or pink as the primary accent color for consistent presentation design. Customize background and text colors to match your corporate brand identity and presentation requirements.
-
Recommended For
Business plan presentations, project management reports, scientific experiment planning documents, educational seminar materials, marketing strategy presentations, product development process explanations, organizational restructuring announcements, system implementation schedules, and all presentation materials requiring step-by-step flow explanations.
-
Slide Structure
Two-slide set featuring blue tone version and pink tone version. Each version consists of four connected oval nodes with icon, step number, title, and description text fields. Connection lines between nodes use arrow format to clearly indicate progression direction, while gray supporting lines provide overall structural stability and visual balance.
Related Products
-

Horticultural Flow Step Analysis – Business Strategy Diagram
#Business Strategy #Diagram #Step-by-Step Schedule Plan
-

Activity Plan Sequence Diagram – Business Strategy Visualization
#Business Strategy #Business Management #Diagram
-

Sea Lighthouse Step-by-Step Business Schedule Plan
#Business Strategy #Diagram #Step-by-Step Schedule Plan
-

Social Media Linear Diagram – Stages of Business Growth
#Company Introduction #Business Strategy #Diagram
