Light Bulb Diagram and Table Chart – Marketing Goals and Strategy Analysis
RJ0700026_21
- Last Update 07/29/2025
- File Size 0.2MB
- # of Slides 2
- File Format PPTX
- Slide Ratio 16:9
- Color
Keywords
- #Content-Based Slides
- #Design-Based Slides
- #Product/Service Introduction
- #Marketing Plan and Strategy
- #Diagram
- #Differentiation Strategy for Products/Services
- #Marketing Objectives
- #Structure
- #Table
- #Pyramid Chart
- #16:9
- #light bulb diagram PowerPoint
- #hierarchical diagram slide
- #marketing strategy presentation
- #comparison table chart
- #business analysis PowerPoint slide
About the Product
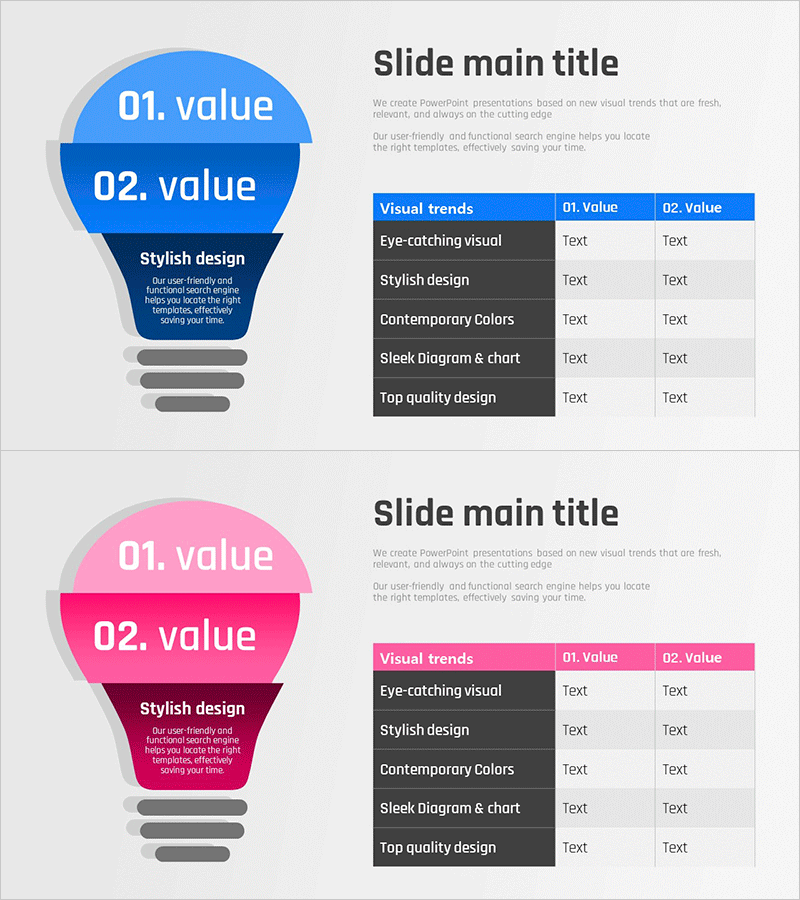
A 2-slide PowerPoint presentation for visualizing marketing goals and strategy analysis. The first slide features a light bulb-shaped hierarchical diagram with two key values (01 and 02) distinguished by blue and pink color schemes. Each section includes editable text areas for stylish design descriptions and detailed content. The second slide presents a comparison table with five categories—visual trends, icons, design, colors, and charts—displayed across two value columns. Ready to use in PowerPoint presentations, this slide set is ideal for marketing strategy planning, product introductions, and business analysis presentations.
Usage Points
-
Main Usage
Organize core marketing values and comparison items visually to support decision-making during strategy planning. The light bulb diagram symbolizes innovation and idea generation, while the comparison table effectively presents multiple options for objective analysis.
-
How to Use
Enter marketing goals and strategies in the light bulb sections on the first slide, then fill in comparison items and data in the table on the second slide. Use the blue and pink colors to distinguish between two scenarios or alternatives, with full flexibility to edit text and numbers.
-
Recommended For
Marketing managers, planners, and strategy teams presenting business plans, marketing proposals, and product introductions. Suitable for executive reports, team meetings, and client pitch decks.
-
Slide Structure
Slide 1: Light bulb hierarchical diagram (2-stage nodes, blue/pink/dark blue tones, 3 editable text areas) / Slide 2: 5-row × 3-column comparison table (blue/pink header row, dark gray data rows, 10 editable text cells)
Related Products
-

Marketing 4P Hierarchy Diagram
#Marketing Plan and Strategy #Diagram #Marketing Objectives
-

4-Level Value Stack Diagram – Business Strategy Visualization Template
#Product/Service Introduction #Business Introduction #Business Vision and Strategy
-

Cloud Smart System Target Revenue Setting – Marketing Strategy and Financial Performance
#Marketing Plan and Strategy #Financial Plans and Performance #Diagram
-

Visualizing Company Vision with History Layer Diagram
#Company Introduction #Marketing Plan and Strategy #Diagram
