Research Project Progress Overlap Diagram
RJ0700026_23
- Last Update 07/29/2025
- File Size 0.1MB
- # of Slides 2
- File Format PPTX
- Slide Ratio 16:9
- Color
Keywords
- #Content-Based Slides
- #Design-Based Slides
- #Product/Service Introduction
- #Business Strategy
- #Diagram
- #Features
- #Cluster
- #Combination Diagram
- #Project Progress
- #16:9
- #overlap diagram PowerPoint
- #project progress slide template
- #5-step process diagram
- #research milestone visualization
- #business progress PowerPoint slide
About the Product
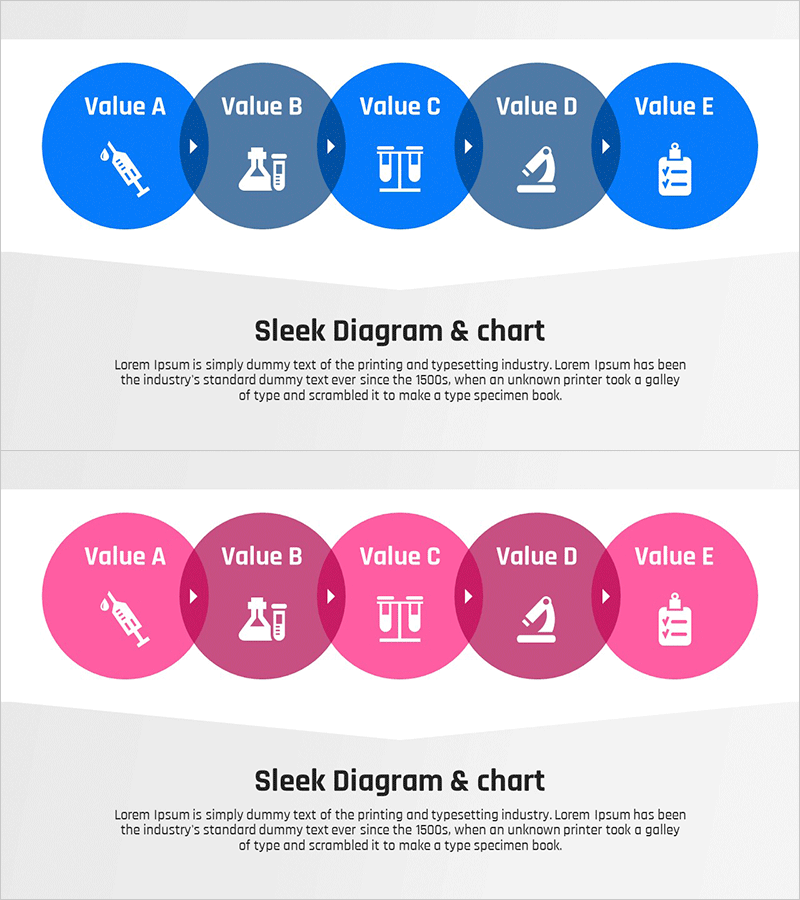
A PowerPoint slide featuring a 5-node overlap diagram to visualize research project progress and sequential workflow stages. Available in two color schemes—blue and pink—with connecting arrows between nodes to clearly show step-by-step advancement. Formatted in 16:9 widescreen ratio with 2 slides, this presentation template is ready to use for project status reports, research milestone tracking, and business progress updates. Each node accommodates icons and editable text, making it ideal for customizing to your specific project phases and communicating key milestones to stakeholders.
Usage Points
-
Main Usage
Designed to visually represent the five sequential phases of research projects or business initiatives. The connected nodes clearly illustrate progression flow and interdependencies, enabling stakeholders to quickly grasp project status and timeline at a glance.
-
How to Use
Edit each circular node with phase names, objectives, responsible parties, and timelines. Select the blue version for formal, trustworthy presentations or the pink version for creative, dynamic contexts. Customize colors and text to match your organization's branding and project specifics.
-
Recommended For
Ideal for research institutions, universities, corporate R&D teams, project managers, business planners, and executives preparing progress reports. Use for periodic status updates, project kickoff meetings, phase-based performance reviews, and investor presentations.
-
Slide Structure
2-slide set with 5 circular nodes arranged horizontally from left to right. Connecting arrows link adjacent nodes to show progression. Each node includes an icon area and text input field. Light gray background provides neutral contrast for content visibility.
Related Products
-

Furniture Company Core Competency Diagram
#Product/Service Introduction #Business Vision and Strategy #Diagram
-

Business Vision Overlay Diagram – Harmony of Clusters and Analysis
#Product/Service Introduction #Business Vision and Strategy #Diagram
-

Service Differentiation Strategy Slide – Striking Visuals and Insights
#Product/Service Introduction #Diagram #Features
-

Key Clients in Furniture Business – Flow of Design Inspiration
#Product/Service Introduction #Customer Success Stories #Diagram
