Description Slides for Key Studies - Emphasizing Scientific Discoveries
RJ0700026_26
- Last Update 07/29/2025
- File Size 0.6MB
- # of Slides 2
- File Format PPTX
- Slide Ratio 16:9
- Color
Keywords
About the Product
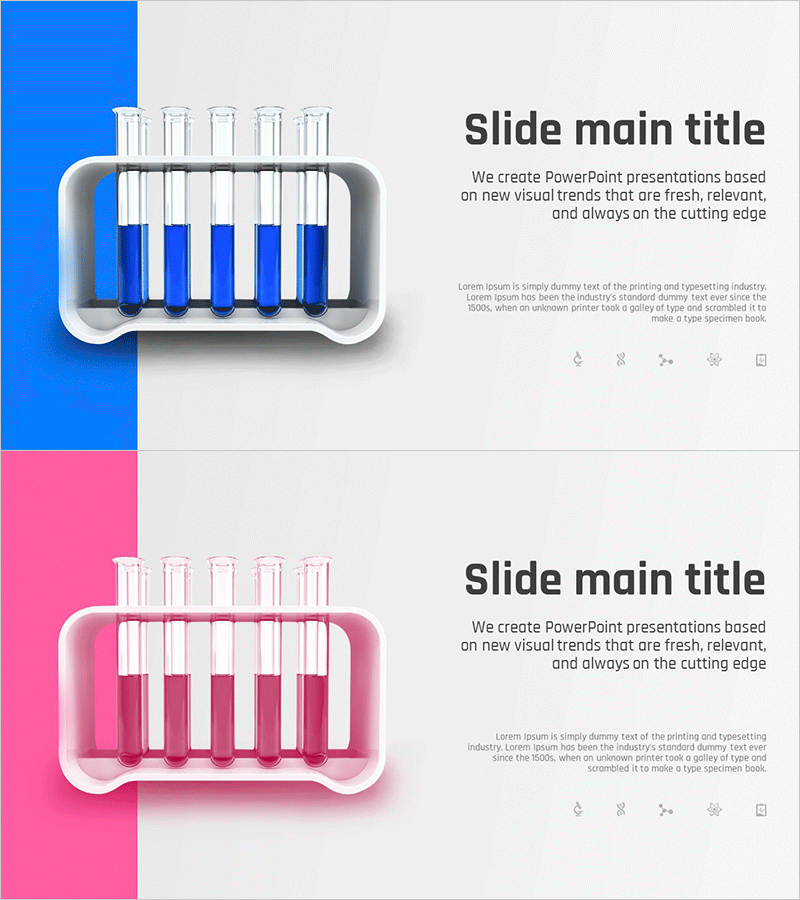
A professional PowerPoint slide for product and service presentations that emphasizes key research findings through scientific data visualization. The design combines test tube illustrations with bar charts to convey research results intuitively. The asymmetrical layout features a colored block on the left (blue or pink) paired with text and graph areas on the right, maintaining visual balance for presentations, technical explanations, and research reports. The 2-slide set offers multiple color options to match your brand identity and presentation needs.
Usage Points
-
Main Usage
This slide effectively presents core research data and scientific discoveries during product or service development presentations. The combination of test tube illustrations and bar charts visually reinforces the credibility of experimental results, making it ideal for investor pitches, partner meetings, and customer presentations to demonstrate technological advantages.
-
How to Use
Place your brand logo or emphasis text in the left colored block, then add research title, description, and numerical data in the right text area. Choose between the blue or pink version to match your corporate colors, ensuring consistency throughout your presentation materials.
-
Recommended For
Ideal for R&D departments, product development teams, technical marketing professionals, and science-based companies presenting at technology briefings, investor relations events, and product launches. Particularly suited for pharmaceutical, biotech, chemical, and IT industry presentations.
-
Slide Structure
Each slide features a two-column layout with a colored block on the left (blue or pink) and text/graph area on the right. Five test tubes and bar charts represent data visually, with clearly defined sections for title, body text, and icons for easy content input.
Related Products
-

Slide Introducing Hobby Gardening – Cluster Design
#Product/Service Introduction #Diagram #Product/Service Introduction
-

Product Showcase Visualized with Natural Phenomena and Text Boxes
#Product/Service Introduction #Product/Service Introduction #Program Introduction
-

Effective Product Introduction with Sprouts and Text Boxes
#Product/Service Introduction #Business Strategy #Product/Service Introduction
-

A Must-Go Course – Attractive Program Introduction
#Product/Service Introduction #Product/Service Introduction #Program Introduction
