Experimental Goal Diagram with Multidirectional Flow
RJ0700026_11
- Last Update 07/29/2025
- File Size 0.5MB
- # of Slides 2
- File Format PPTX
- Slide Ratio 16:9
- Color
Keywords
- #Content-Based Slides
- #Design-Based Slides
- #Business Vision and Strategy
- #Marketing Plan and Strategy
- #Diagram
- #Business Goals
- #Marketing Objectives
- #Flow
- #Multidirectional Flow
- #16:9
- #multidirectional diagram PowerPoint
- #arrow flow diagram slide
- #goal achievement pathway
- #PowerPoint diagram slide
- #flowchart presentation template
About the Product
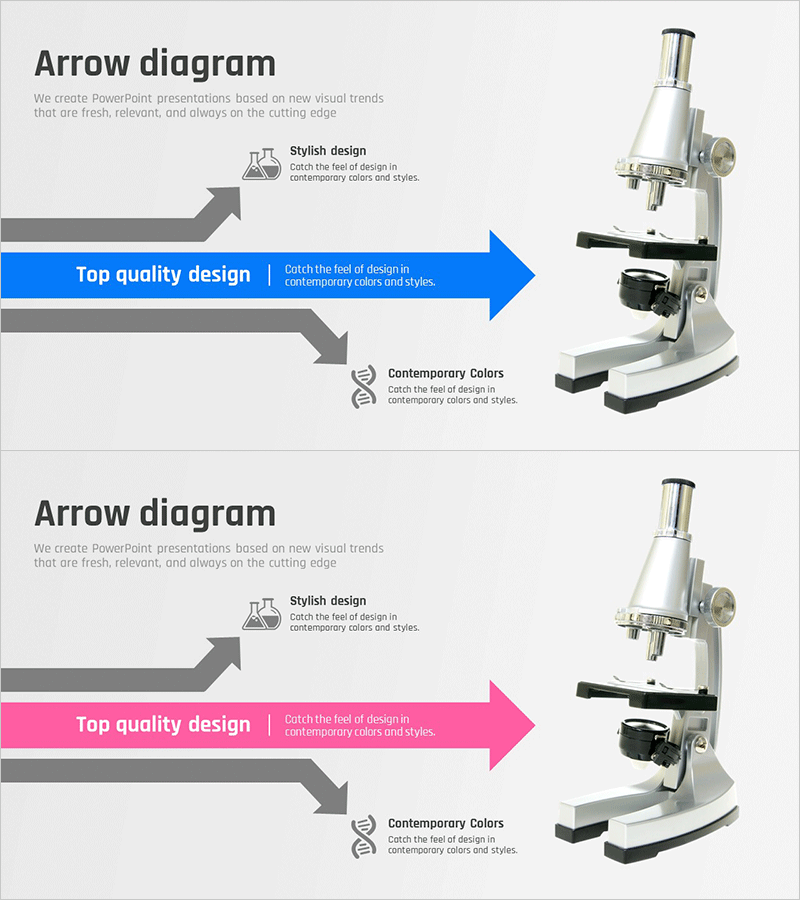
A PowerPoint slide that visualizes experimental goals and strategic initiatives using multidirectional arrow flows. Upward, downward, and lateral arrows converge toward a central message, effectively illustrating complex goal achievement pathways. Blue and pink accent colors distinguish each directional flow against a neutral gray background. Ample text areas allow detailed descriptions for each flow direction, making this presentation slide immediately applicable to marketing objectives, business vision statements, and project implementation phases.
Usage Points
-
Main Usage
Visualizes experimental goals, marketing strategies, and business visions where multiple directional flows converge toward a central objective. The upward, downward, and lateral arrow structure clearly communicates complex implementation pathways and goal achievement processes.
-
How to Use
Input strategic initiatives, execution tasks, or performance metrics into each arrow direction, and place the final objective in the central text box. Maintain the blue and pink color scheme or customize with corporate brand colors to create a cohesive presentation.
-
Recommended For
Marketing managers, business planning teams, R&D departments, and executives preparing strategic reports. Ideal for business plans, marketing proposals, project pitches, and strategic presentations where goal pathways require clear visualization.
-
Slide Structure
Two-slide set with 3-way converging arrows (upward, downward, lateral) on each layout. First slide features blue accent color; second slide uses pink accent for color variation options. Each arrow and central box includes editable text areas for flexible customization.
Related Products
-

Multi-directional Business Goal Setting Slide – Strategic Vision & Marketing Plan
#Business Vision and Strategy #Marketing Plan and Strategy #Diagram
-

Setting Goals for Business Growth – Vision and Marketing Strategy
#Business Vision and Strategy #Marketing Plan and Strategy #Diagram
-

Goal Diagram for Solving Drug Problems
#Business Vision and Strategy #Marketing Plan and Strategy #Diagram
-

Strategic Marketing Goals Diagram – Multidirectional Flow Towards Vision and Growth
#Business Vision and Strategy #Marketing Plan and Strategy #Diagram
