Chemistry Lab Presentation Template - Eye-Catching Visual Design
J0700008
- Last Update 12/29/2024
- File Size 18.1MB
- # of Slides 31
- File Format PPTX
- Slide Ratio 16:9
- Color
Slide Preview


Keywords
About the Product
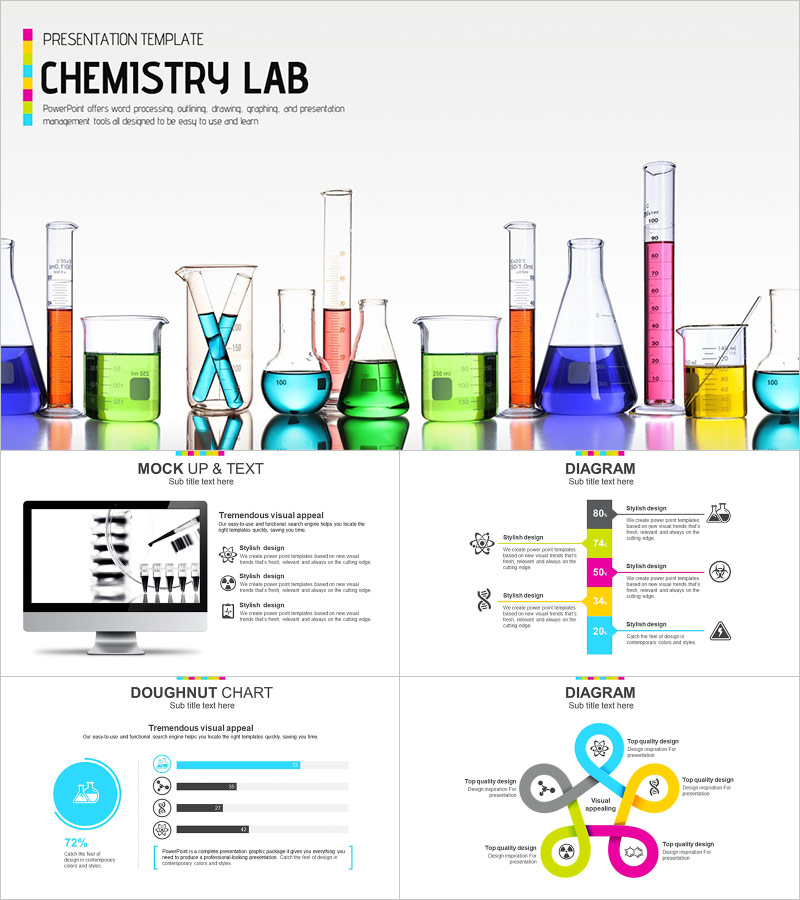
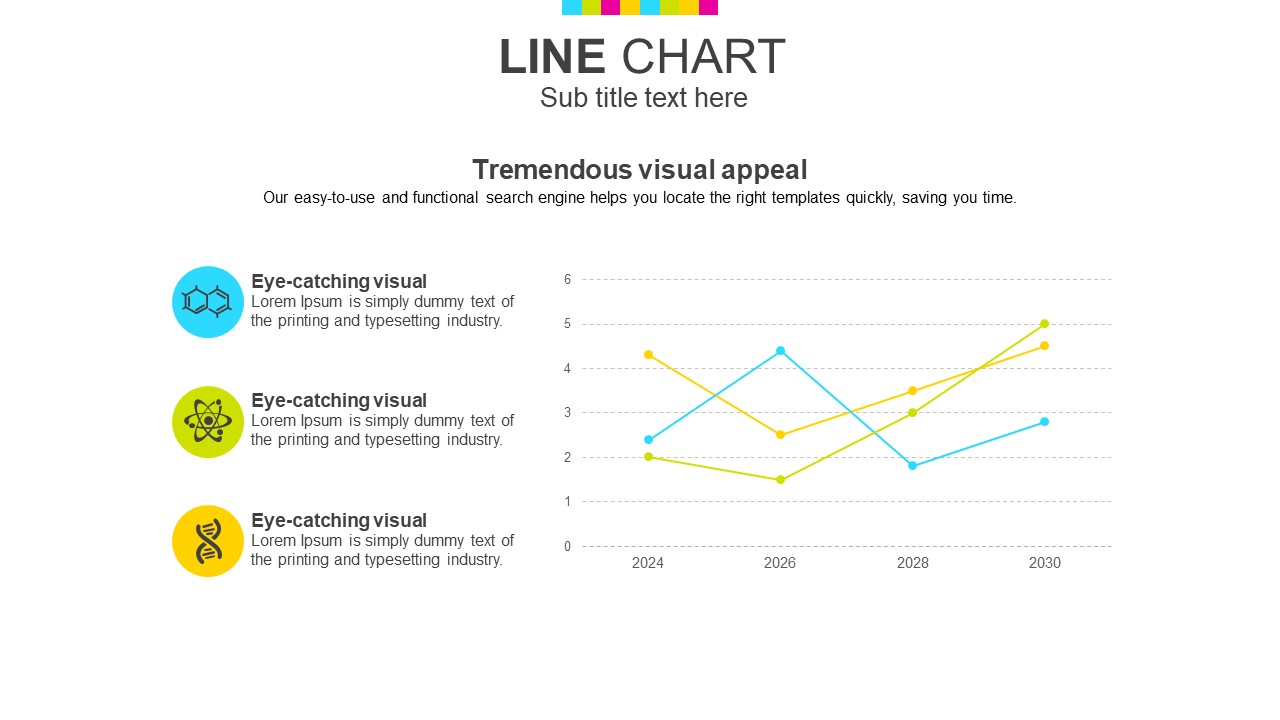
This chemistry and science PowerPoint template features a clean white background with vibrant cyan and lime green accent colors, creating a professional yet visually dynamic presentation deck. The title slide showcases a full-width laboratory glassware photo filled with colorful liquids, immediately establishing a scientific atmosphere. Inside, you'll find a well-organized set of data visualization slides including horizontal bar charts in dual cyan-and-lime color coding, doughnut charts paired with science icons, and percentage-based diagrams with line-style icons such as flasks, DNA strands, and atomic structures. The 31-slide PPTX file is fully editable, allowing researchers, educators, and science professionals to replace text, data, and images with ease. Whether you're presenting lab results, academic research, or science education materials, this presentation template provides a structured and visually consistent framework for your slides.
Usage Points
-
Main Usage
Designed for chemistry and science professionals who need to present research findings, lab reports, or academic data. The data-rich slide layouts support clear communication of experimental results and scientific metrics.
-
How to Use
Download the PPTX file and open it in PowerPoint or a compatible application. Replace the placeholder text, numbers, and images with your own content. Charts update automatically when you input new data values.
-
Recommended For
Graduate students and researchers presenting at academic conferences, pharmaceutical and biotech companies reporting R&D results, science teachers preparing classroom materials, and professionals in chemistry-related fields.
-
Slide Structure
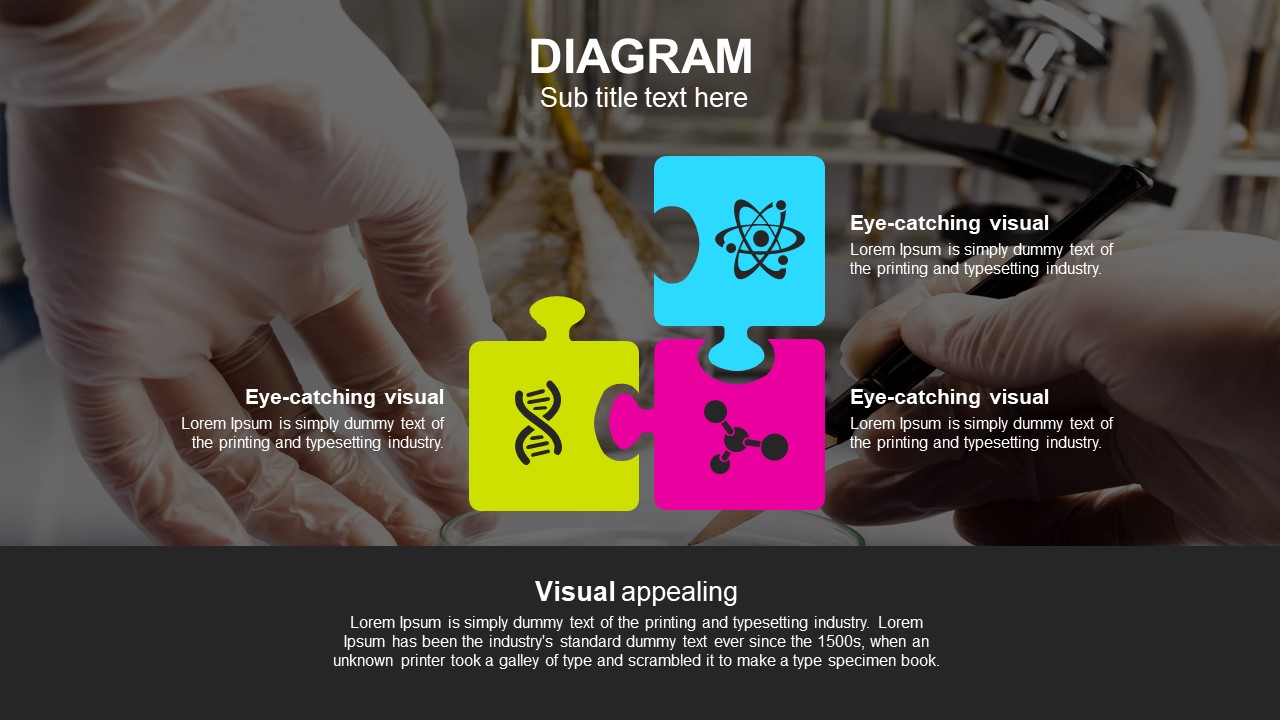
Includes a laboratory glassware title slide, mock-up and text layout, percentage diagrams with science icons (flask, DNA, atom), dual-color horizontal bar charts in cyan and lime, and doughnut charts linked to four science icon categories — 31 slides total.
Related Products
-

New Drug Introduction Presentation Template – Scientific and Stylish Design
#Science/Medical
-

Rocket Presentation Wide Template – Sleek and Intuitive Design
#Science/Medical
-

Space Presentation Template – Mystical and Captivating Design
#Science/Medical
-

Astronomy Presentation Template – Stylish Design for Exploring the Universe
#Science/Medical
