Research Ratio Analysis Graph – Analyzing Market Dynamics
RJ0700026_20
- Last Update 07/29/2025
- File Size 0.1MB
- # of Slides 2
- File Format PPTX
- Slide Ratio 16:9
- Color
Keywords
- #Content-Based Slides
- #Design-Based Slides
- #Product/Service Introduction
- #Market and Competitor Analysis
- #Graph
- #Development Status
- #Market Analysis
- #Circles
- #Doughnut Chart
- #16:9
- #donut chart PowerPoint slide
- #ratio analysis presentation template
- #pie chart slides
- #market analysis PowerPoint
- #how to create donut chart in PowerPoint
About the Product
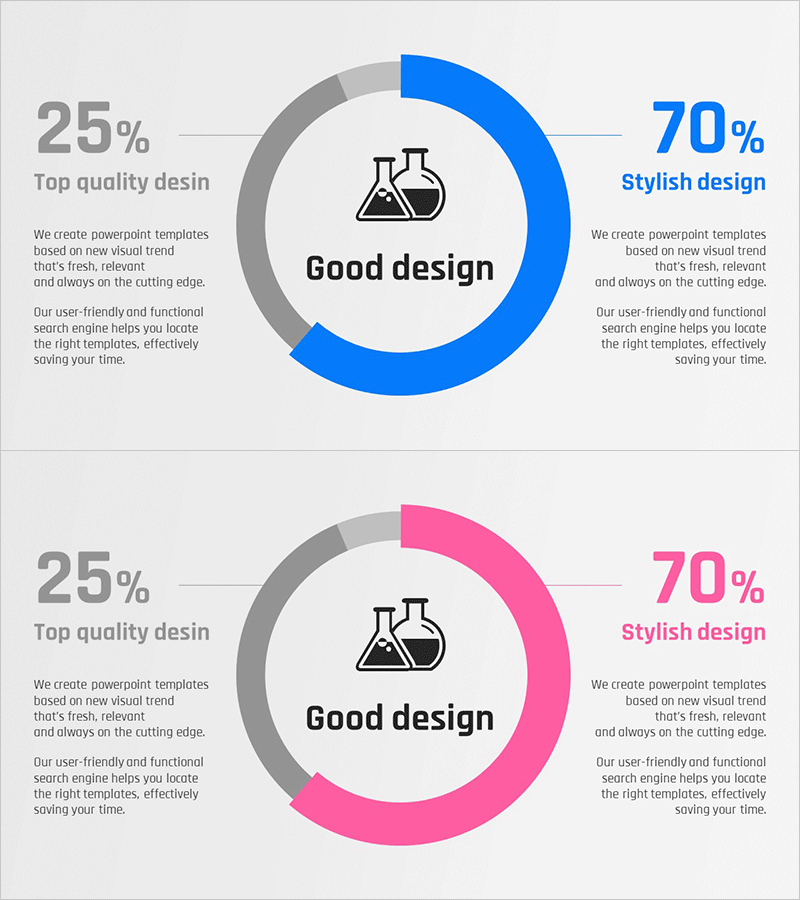
A donut chart PowerPoint slide template for market analysis and current status assessment. This 2-slide presentation features a central messaging area with 25% and 70% ratio visualization on both sides, available in blue and pink color versions. Each slide includes a detailed text description area on the left to convey qualitative analysis alongside quantitative data. Designed in 16:9 widescreen PPTX format compatible with all presentation environments, with fully editable structure for immediate customization.
Usage Points
-
Main Usage
Ideal for comparing two key ratios simultaneously, such as market research findings, customer satisfaction scores, or product market share. The central messaging area clarifies the analysis topic, while the left text section presents detailed insights and supporting data interpretation.
-
How to Use
Use in market analysis presentations, business performance reports, and research findings where quantitative metrics and qualitative interpretation must be presented together. Blue version suits professional reports requiring credibility; pink version emphasizes creativity and innovation in strategic presentations.
-
Recommended For
Marketing professionals, executives, research analysts, and consultants presenting quarterly or annual performance analysis, market entry strategies, customer segmentation studies, and competitive positioning reports.
-
Slide Structure
2-slide layout. Each slide features a central donut chart with laboratory flask icon and 'Good design' text, displaying 25% and 70% ratio segments in solid blue or pink color. Left side contains dedicated text description area for detailed analysis. Donut segments use flat color without gradients for clear ratio distinction and professional appearance.
Related Products
-

Detailed Analysis Circle Graph Presentation Template
#Product/Service Introduction #Market and Competitor Analysis #Graph
-

Business Investment Market Analysis Donut Graph
#Product/Service Introduction #Market and Competitor Analysis #Diagram
-

Development Analysis Donut Graph – Visual Data Presentation
#Product/Service Introduction #Market and Competitor Analysis #Graph
-

Development Status Analysis Donut-Shaped Circle Graph
#Product/Service Introduction #Market and Competitor Analysis #Graph
