Genetic Analysis Bar Graph – Data Visualization for Market Analysis
RJ0700026_6
- Last Update 07/29/2025
- File Size 0.6MB
- # of Slides 2
- File Format PPTX
- Slide Ratio 16:9
- Color
Keywords
- #Content-Based Slides
- #Design-Based Slides
- #Market and Competitor Analysis
- #Marketing Plan and Strategy
- #Graph
- #Market Analysis
- #Promotion Strategy
- #Column
- #Segmented Column
- #16:9
- #bar chart PowerPoint
- #vertical bar graph template
- #data comparison slide
- #market analysis chart
- #year-over-year comparison
- #3-series bar chart PowerPoint
About the Product
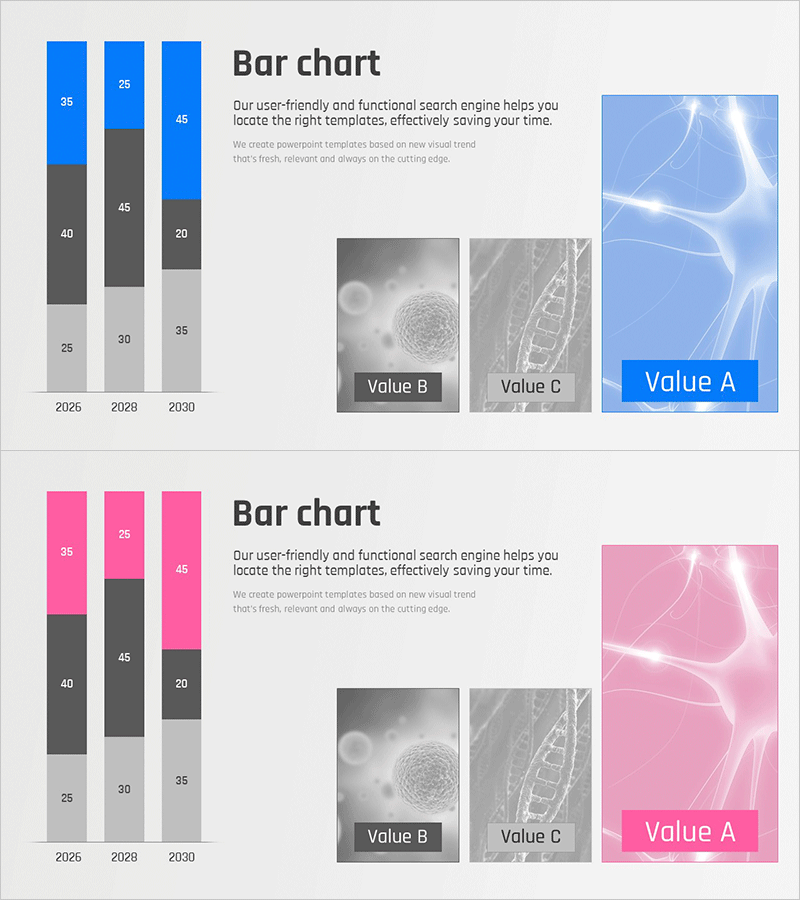
A professional vertical bar chart PowerPoint slide designed for market analysis and competitive benchmarking. This presentation template visualizes data across three series and three years (2026, 2028, 2030), making it ideal for comparing sales trends, market share, growth rates, and competitive metrics. The slide includes numeric labels on each bar for clarity and comes in three color variations—blue, pink, and gray—to match your presentation theme. With 2 slides included, you can immediately edit and customize the data to suit your business needs.
Usage Points
-
Main Usage
Effectively compare quantitative data across multiple years and categories to visualize market trends and performance metrics. Ideal for presenting sales figures, market share, growth rates, and competitive analysis in a clear, professional format.
-
How to Use
Bar height and color differentiation allow audiences to instantly grasp numerical differences and trends. Clear axis labels and data values on each bar facilitate smooth presentation delivery and audience comprehension.
-
Recommended For
Marketing professionals, executives, business analysts, and consultants presenting quarterly or annual performance reports, competitive analysis, and market research findings. Suitable for business plans, investor pitch decks, and marketing strategy presentations.
-
Slide Structure
Comprises 3 bar groups across 3 years (2026, 2028, 2030) totaling 9 bars with numeric labels. Three color variations—blue, pink, and gray—are provided as separate slides for flexible design customization.
Related Products
-

Business Goal Setting & Analysis Graph – For Competitive Analysis
#Market and Competitor Analysis #Marketing Plan and Strategy #Graph
-

Medical Services Characteristics Connection Diagram
#Market and Competitor Analysis #Graph #Customer Analysis
-

5-Year Real Estate Volume Chart – Market Analysis
#Market and Competitor Analysis #Graph #Market Analysis
-

Market Analysis and Status Graph - Harmony of Blue and Orange
#Market and Competitor Analysis #Graph #Market Status
