Table Slide Visualizing Financial Performance with DNA Theme
RJ0700026_18
- Last Update 07/29/2025
- File Size 0.4MB
- # of Slides 2
- File Format PPTX
- Slide Ratio 16:9
- Color
Keywords
- #Content-Based Slides
- #Design-Based Slides
- #Financial Plans and Performance
- #Diagram
- #Income Statement
- #Key Financial Indicators
- #Table
- #Standard Table
- #16:9
- #table slide PowerPoint
- #financial data comparison template
- #6-column table slide
- #financial performance visualization
- #business metrics PowerPoint template
About the Product
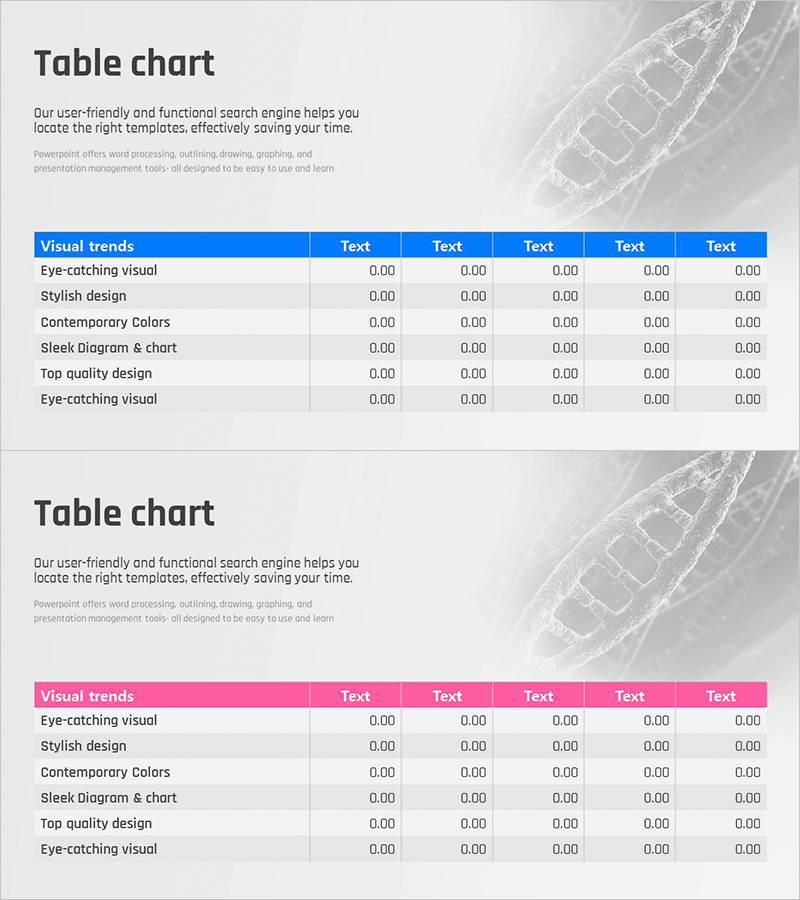
A professional 6-column table PowerPoint slide designed for comparing and organizing financial performance, budget data, and business metrics. Available with blue and pink header options, each row features visual emphasis elements and numeric input areas for clear data presentation. This 2-slide set (16:9 aspect ratio) is ready to use in financial reports, business plans, and performance analysis presentations. Text and color customization are fully editable, making it adaptable to various corporate documents and reporting needs.
Usage Points
-
Main Usage
Presents numerical data such as financial results, sales figures, and operational metrics in a clear row-and-column structure. Visual emphasis elements in each row highlight key information, enabling effective information hierarchy and comparative analysis across multiple data points.
-
How to Use
Insert into financial reports, business plans, quarterly earnings presentations, and investor pitch decks within the data analysis section. Select header color (blue or pink), input text and numerical values, and customize by adding or removing rows as needed for your specific data set.
-
Recommended For
CFOs, financial analysts, business managers, executives, and marketing professionals who rely on data-driven presentations. Ideal for quarterly performance reviews, budget planning sessions, performance benchmarking, and financial forecasting presentations.
-
Slide Structure
Two-slide set featuring one blue-header table and one pink-header table. Each table contains 6 columns and 6 rows, with the first column for item names and the remaining 5 columns for numeric values, percentages, and descriptions. Headers use white text on colored backgrounds, while body rows have light gray backgrounds for enhanced readability.
Related Products
-

Illustration Theme Income Statement Table – Visualization of Financial Performance
#Financial Plans and Performance #Diagram #Income Statement
-

Table Chart of Point Frames – Profit and Loss Statement and Key Financial Metrics
#Financial Plans and Performance #Diagram #Income Statement
-

Income Statement Table – Clearly Presenting Financial Plans and Performance
#Financial Plans and Performance #Diagram #Income Statement
-

Business Income Statement – Visualizing Financial Performance
#Financial Plans and Performance #Diagram #Income Statement
