Diagram of Scientific Research Areas Diffusion
RJ0700026_13
- Last Update 07/29/2025
- File Size 0.8MB
- # of Slides 2
- File Format PPTX
- Slide Ratio 16:9
- Color
Keywords
- #Content-Based Slides
- #Design-Based Slides
- #Company Introduction
- #Business Introduction
- #Diagram
- #Business Areas
- #Business Areas
- #Spread
- #Centralized Diagram
- #16:9
- #radial diagram PowerPoint
- #diffusion diagram slide template
- #6-node diagram presentation
- #scientific research diagram
- #center-based diagram PowerPoint
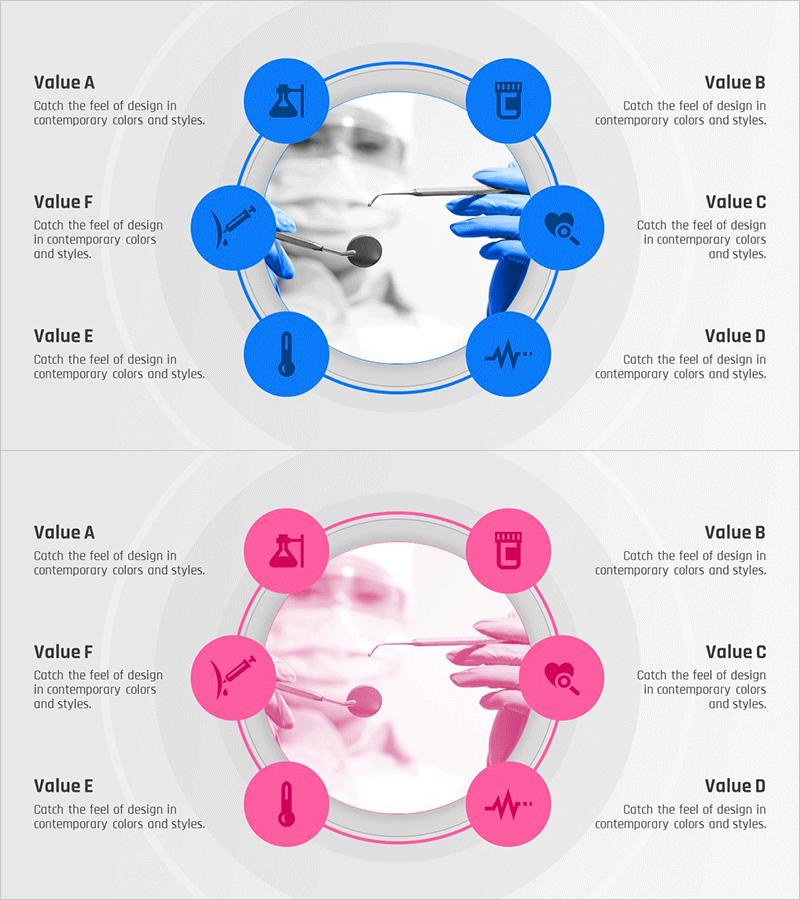
About the Product
A radial diagram PowerPoint slide with six nodes expanding outward from a central concept. Designed for visualizing scientific research domains, business areas, organizational functions, and interconnected concepts. The slide set includes two color versions: blue and pink, each with icon placeholders and text input areas for customization. This diagram structure effectively communicates complex relationships and multi-directional connections in presentations. The 2-slide template is ready to use immediately, with fully editable colors, icons, and text fields to match your presentation theme.
Usage Points
-
Main Usage
Visualizes the relationship between a central concept and multiple related elements radiating outward. Ideal for scientific research presentations, business domain analysis, organizational structure explanations, multi-channel marketing strategies, and any concept requiring center-to-periphery expansion visualization.
-
How to Use
Enter your main topic in the central node and add related subtopics or elements in the six surrounding nodes. Customize icons and colors to match your presentation theme. Apply slide transition effects to emphasize the outward expansion from center, creating visual impact and audience engagement.
-
Recommended For
Scientific and technical research presentations, new business domain introductions, organizational structure and function explanations, marketing strategy presentations, product development process descriptions, executive reports, academic seminars, and educational materials. Suitable for any presentation requiring clear visualization of complex, multi-faceted concepts.
-
Slide Structure
2-slide template featuring a radial structure with one central circular node connected to six surrounding nodes via lines. Each node includes an icon placeholder and text input area. Two color variations provided: blue and pink versions, allowing selection based on presentation context or organizational branding preferences.
Related Products
-

Business Area Circular Diagram – Enhancing Corporate Presence
#Company Introduction #Business Introduction #Diagram
-

Astronomy Earth Diagram PowerPoint – Visual Exploration
#Company Introduction #Business Introduction #Diagram
-

Equipment and Marketing Strategy Diagram – Visualizing Business Structure
#Company Introduction #Business Introduction #Diagram
-

Hexagonal Diffusion Diagram for Business Area Visualization
#Company Introduction #Business Introduction #Diagram
