
Research Process PPT – Visually Striking Design
J0700001
- Last Update 12/31/2024
- File Size 8.6MB
- # of Slides 32
- File Format PPTX
- Slide Ratio 16:9
- Color
Slide Preview


Keywords
About the Product
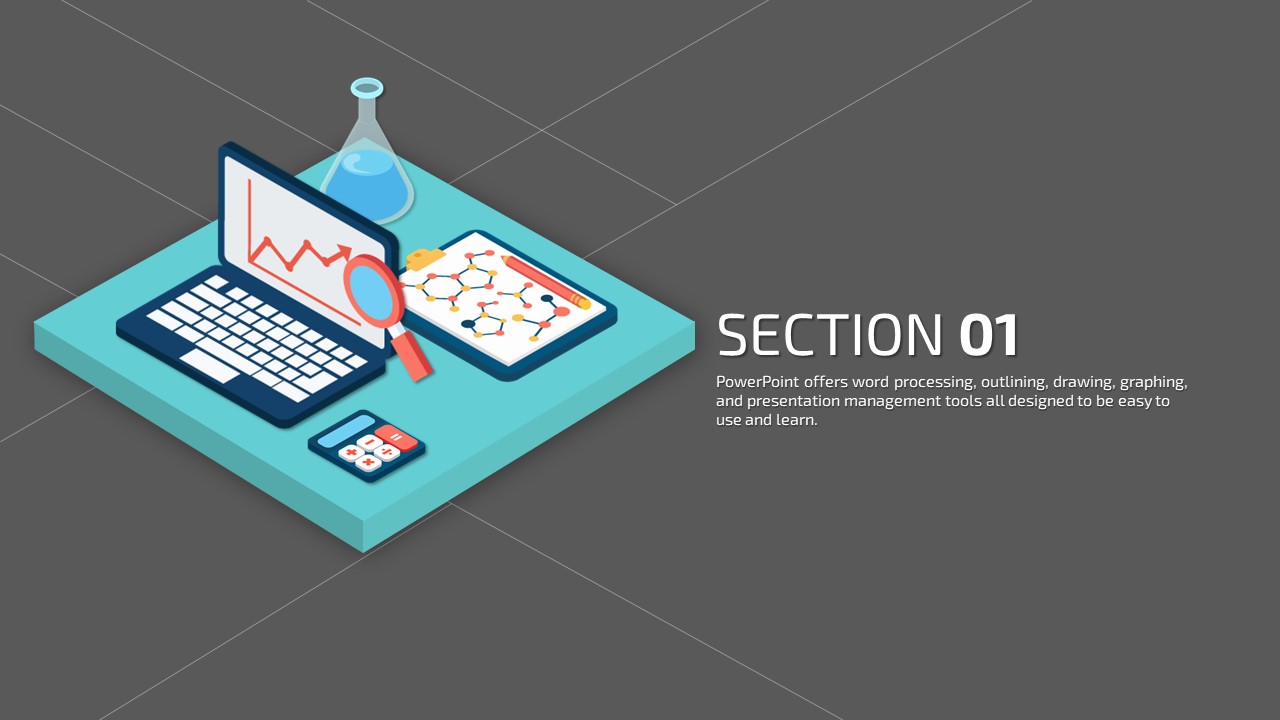
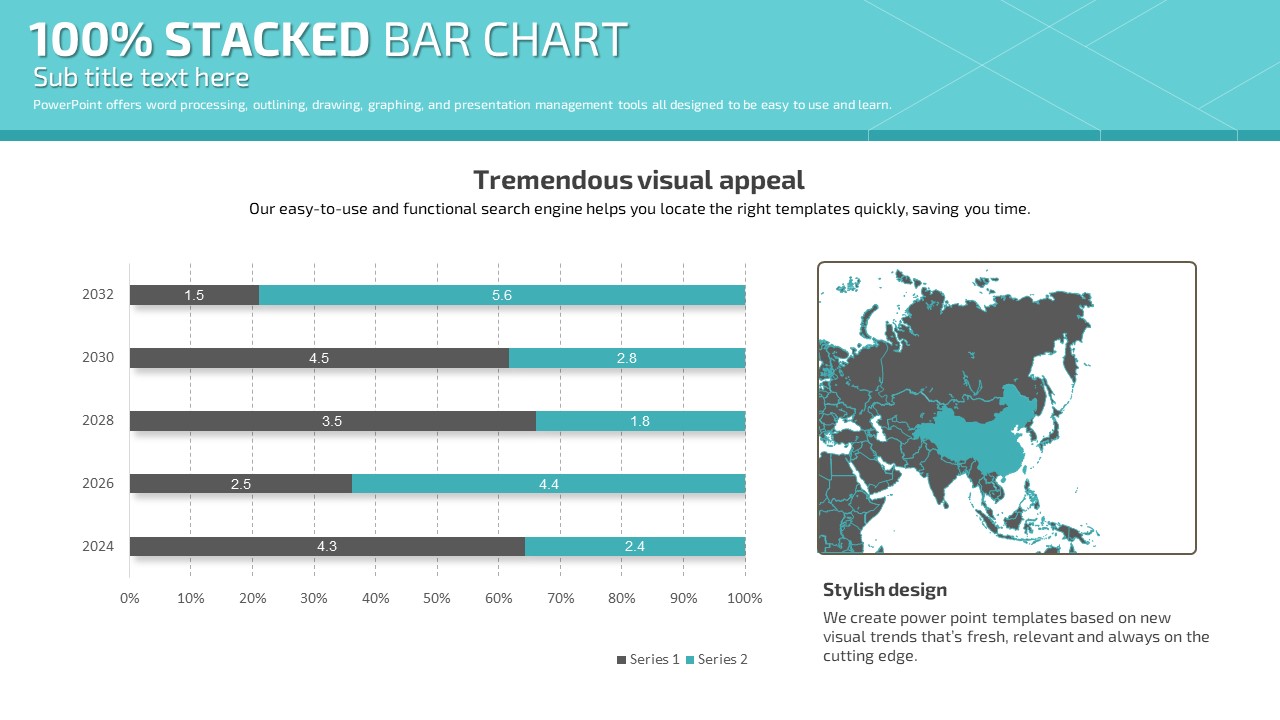
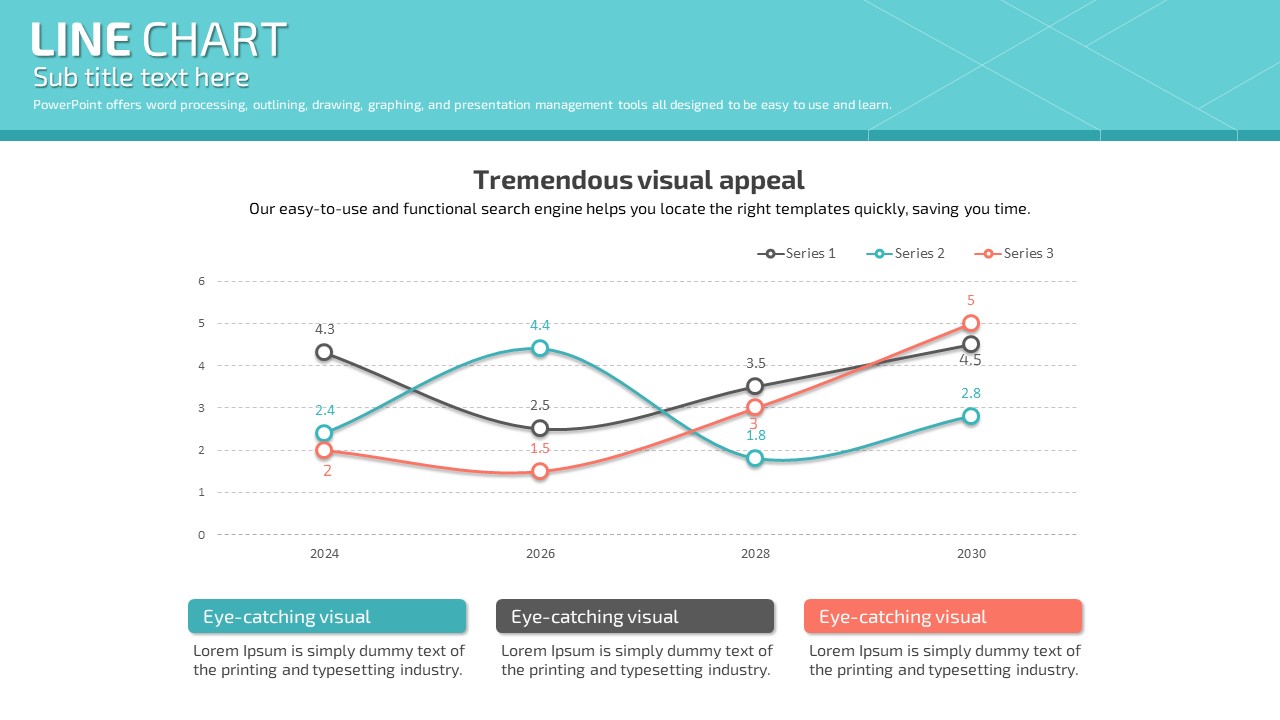
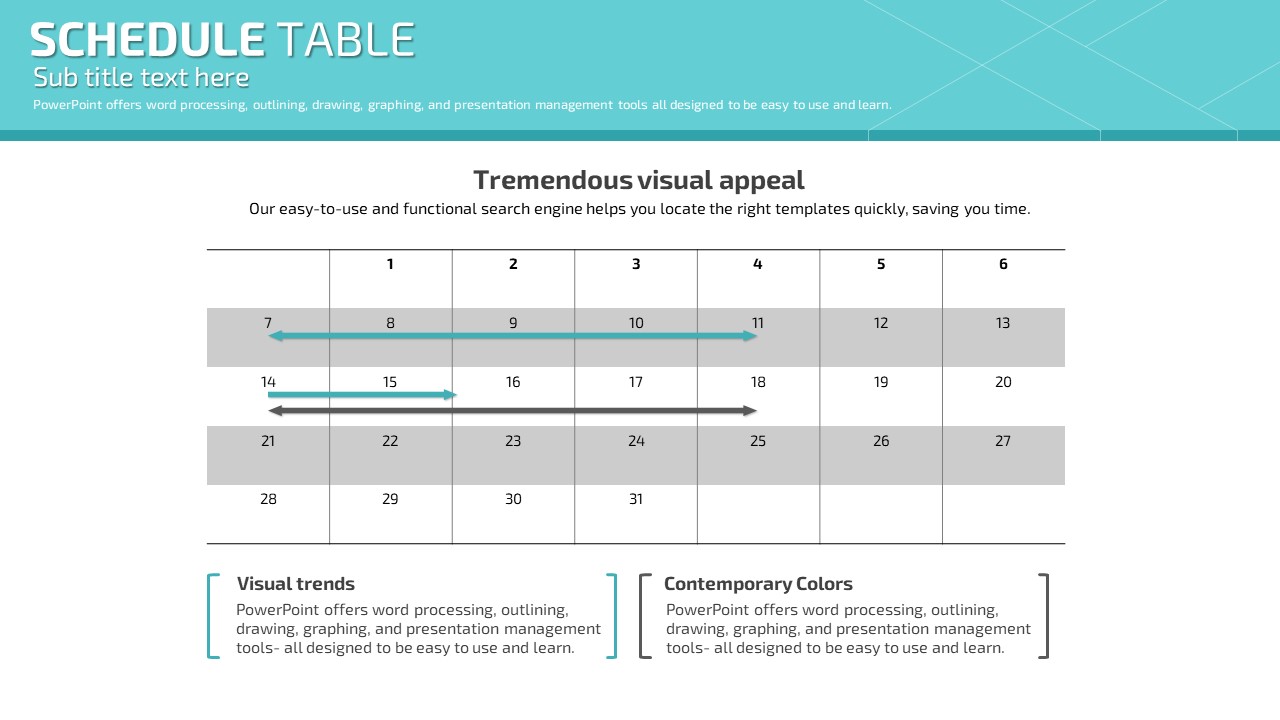
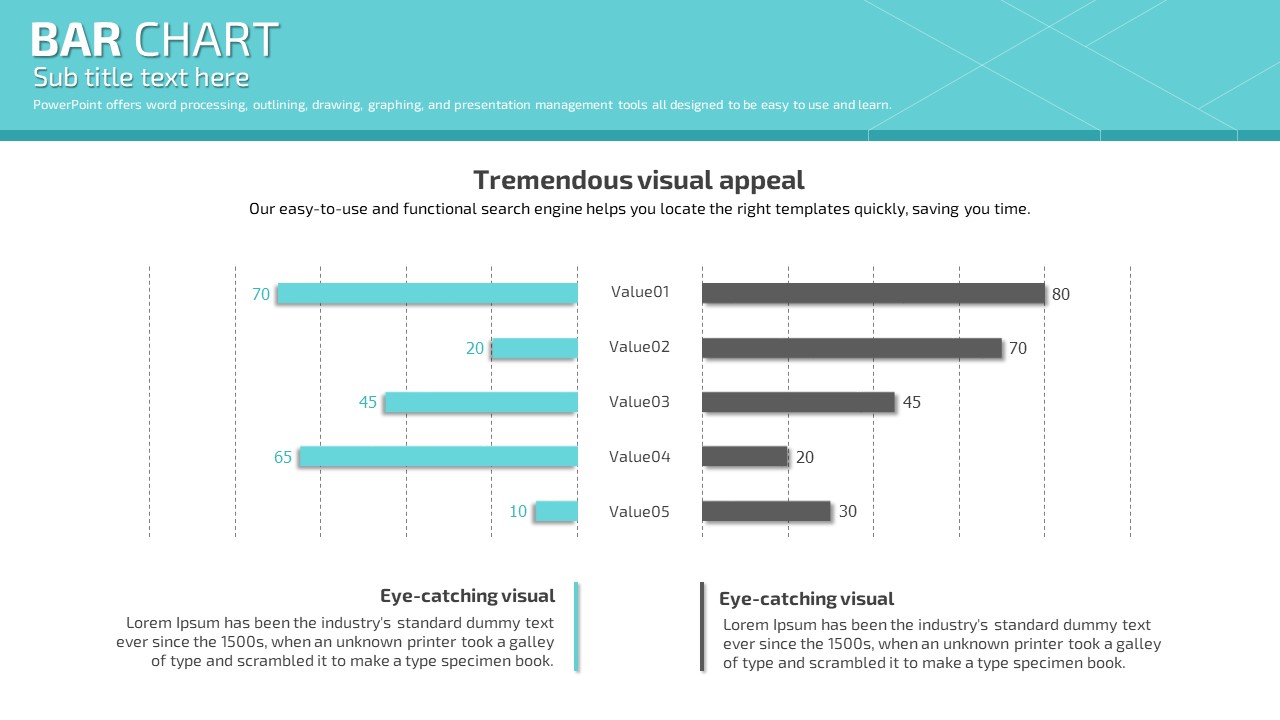
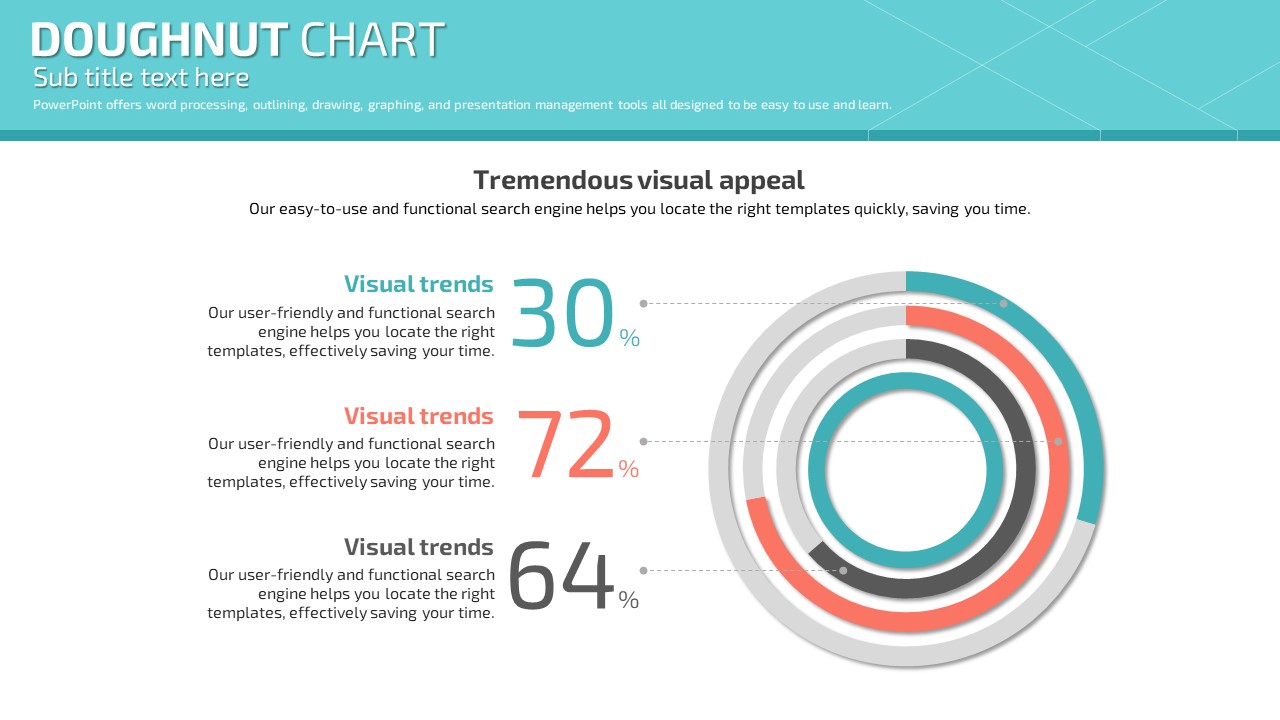
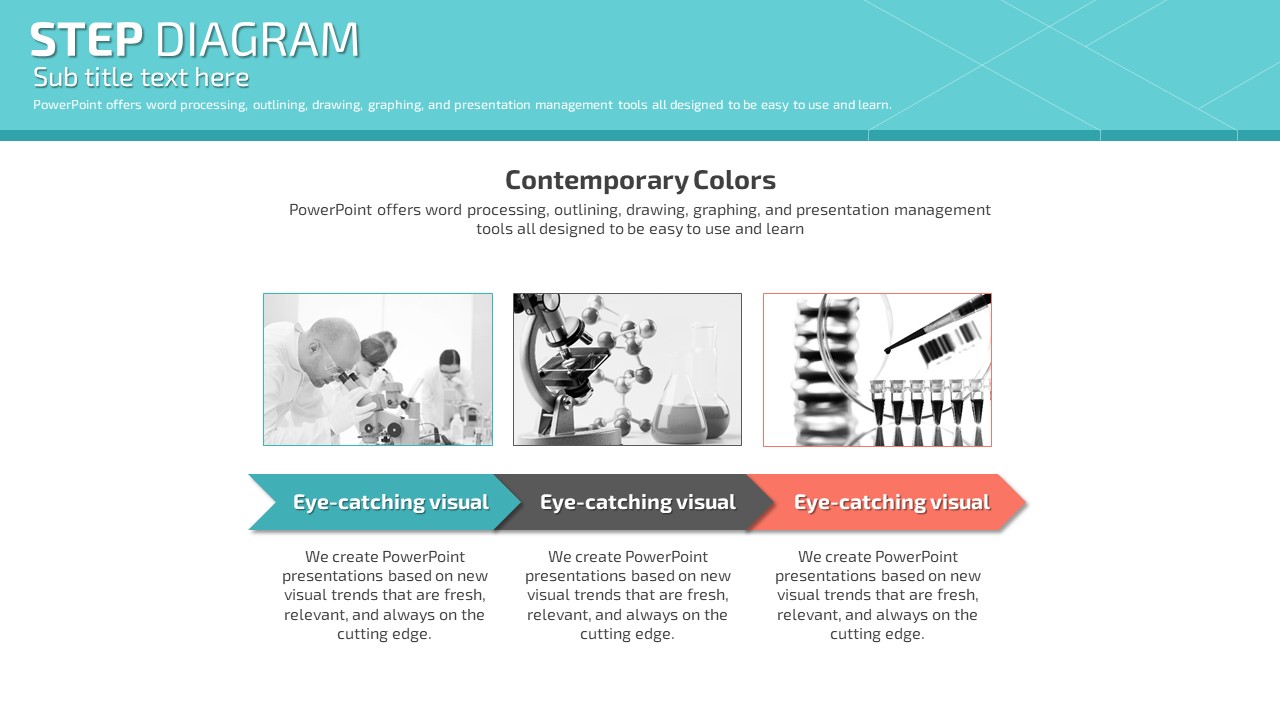
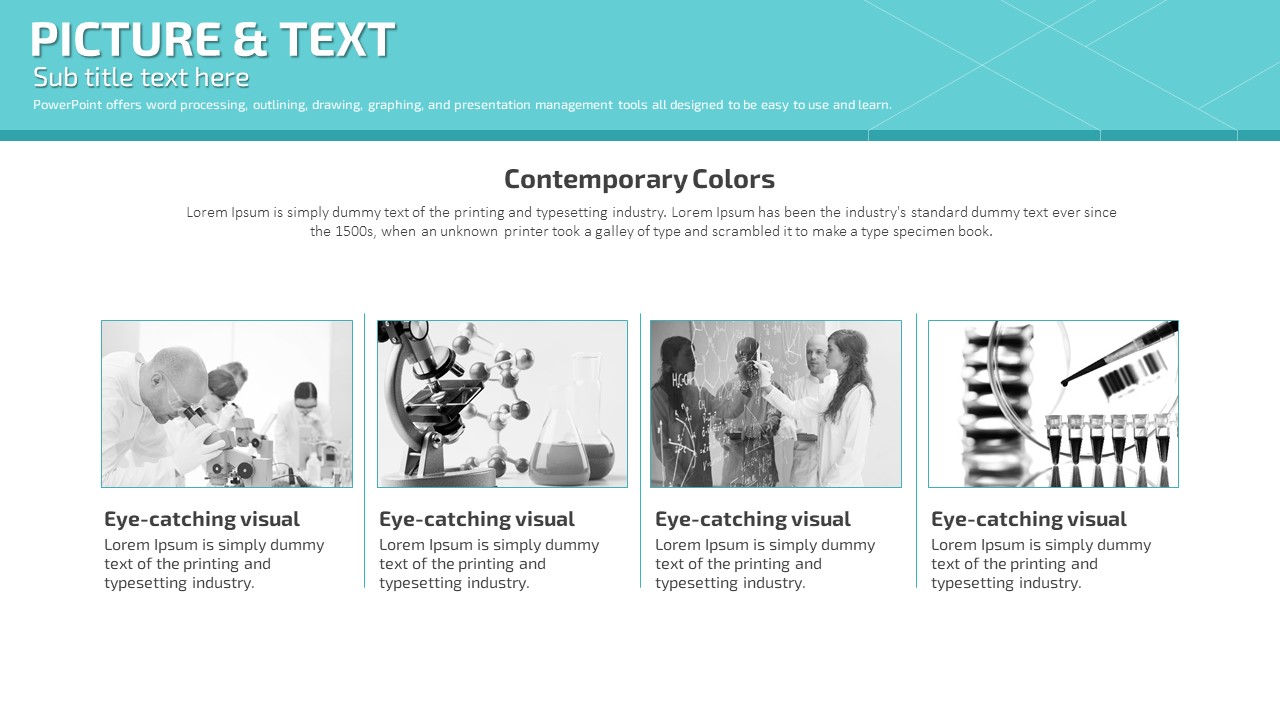
This PowerPoint template visualizes the full scientific research process—from laboratory experiments and data analysis to research center operations—using isometric 3D icon flowcharts. Built on a teal and white color scheme with multicolor accent icons, the design communicates each research stage clearly and professionally. The 32-slide deck covers every phase of a research presentation: title slide, team member introduction, Venn diagram, circular diagram, world map with regional data, multi-series line chart (2024–2030 trend), and a Gantt-style schedule table. A two-column grid layout balances text and visuals throughout, making the slides easy to read on large screens. All slides are fully editable in PPTX format, so you can replace research steps, team profiles, and data figures with your own content in minutes. Ideal for academic conferences, lab reports, pharmaceutical R&D presentations, and science project pitches.
Usage Points
-
Main Usage
Designed to present the full scientific research process—from ideation and experiments to data center analysis and first results—in a visually structured, stage-by-stage format for academic and corporate research audiences.
-
How to Use
Download the PPTX file and replace the placeholder research steps, team member names, and data figures with your own content. The isometric icons and chart slides can be used as-is or recolored to match your institution's brand identity.
-
Recommended For
Graduate students, researchers, and scientists preparing academic conference presentations; R&D teams at pharmaceutical, biotech, or engineering firms; and undergraduate students presenting science or engineering projects.
-
Slide Structure
32 slides including: teal isometric flowchart title slide, 4-person team member introduction, Venn diagram, 3D circular diagram (Color / Design / Appeal), world map with percentage data, multi-series line chart (2024–2030), and a Gantt-style monthly schedule table.
Related Products
-

Medical Presentation Template for Surgery – Professional and Sleek Design
#Science/Medical
-

New Drug Introduction Presentation Template – Scientific and Stylish Design
#Science/Medical
-

Cell PPT Wide Template – Refreshing and Scientific Design
#Science/Medical
-

Space Presentation Template – Mystical and Captivating Design
#Science/Medical
