Development Status Donut-Shaped Circle Graph – Visualizing Market Share
RJ0700001_29
- Last Update 07/21/2025
- File Size 0.6MB
- # of Slides 2
- File Format PPTX
- Slide Ratio 16:9
- Color
Keywords
- #Content-Based Slides
- #Design-Based Slides
- #Product/Service Introduction
- #Market and Competitor Analysis
- #Graph
- #Development Status
- #Market Share
- #Circles
- #Doughnut Chart
- #16:9
- #donut chart PowerPoint slide
- #pie chart template
- #market share visualization
- #ratio chart slide
- #how to create donut chart in PowerPoint
- #PowerPoint graph slide template
About the Product
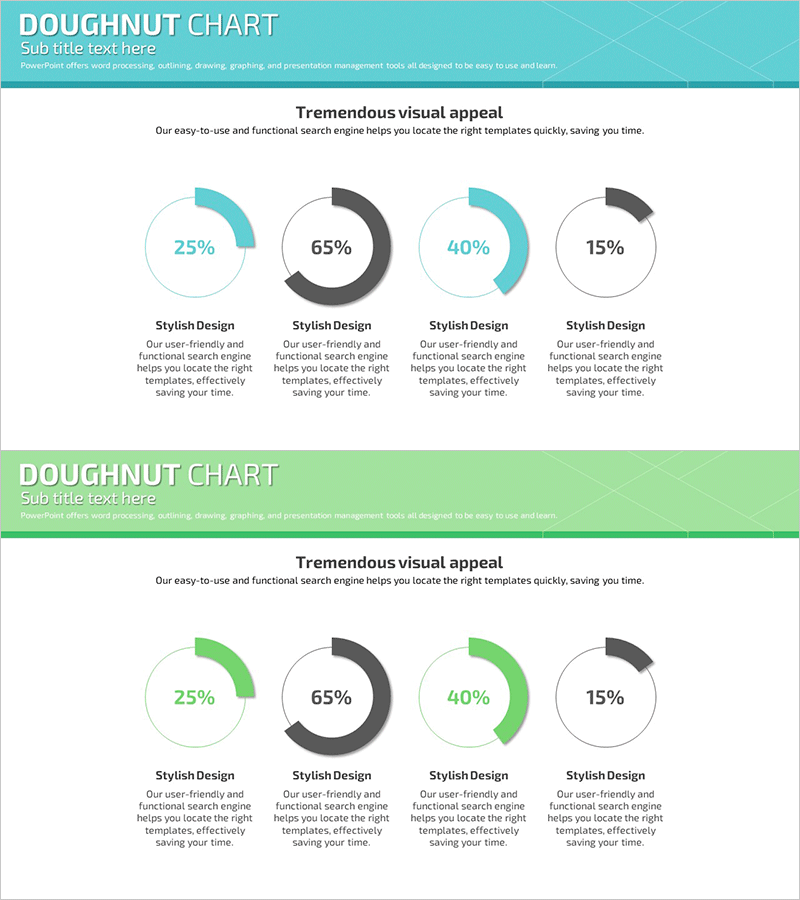
A professional donut chart PowerPoint slide set designed to visualize market share, sales distribution, customer composition, and proportional data. This 2-slide template features a turquoise and gray color scheme with four segmented donut charts per slide, enabling clear ratio-based data representation. Each chart includes editable percentage labels and descriptive text areas for seamless integration into business presentations, reports, and proposals. Provided in 16:9 widescreen PPTX format with fully customizable elements for quick adaptation to your specific data.
Usage Points
-
Main Usage
Effectively communicates proportional relationships such as market share percentages, sales distribution, budget allocation, and customer demographic breakdowns. The hollow center of each donut allows for additional key metrics or titles, maximizing information density and visual clarity.
-
How to Use
Insert this template into the analysis or results section of your presentation to visualize statistical data. Simply replace the percentage values and legend labels with your own data. Ideal for quarterly reports, market analysis presentations, business proposals, and executive briefings.
-
Recommended For
Marketing teams presenting market analysis, sales teams showcasing performance metrics, finance departments explaining budget distribution, product teams analyzing customer segmentation, and executives delivering business performance reports. Suitable for any role requiring proportion-based data visualization.
-
Slide Structure
Two-slide set with four donut charts per slide. First slide emphasizes turquoise accents; second slide features green accents for design variation. Each chart includes editable percentage text, legend labels, and descriptive text boxes below for contextual information and detailed explanations.
Related Products
-

Space Exploration Donut Pie Chart
#Product/Service Introduction #Market and Competitor Analysis #Graph
-

Business Idea Development Status Graph – Ideas and Growth
#Product/Service Introduction #Market and Competitor Analysis #Graph
-

Sales Status Analysis Graph – Simple and Stylish Design
#Product/Service Introduction #Market and Competitor Analysis #Graph
-

Website Technology Development Status Graph – Market Share and Trends
#Product/Service Introduction #Market and Competitor Analysis #Graph
