Table Charts for Successful Market Analysis
RJ0700001_28
- Last Update 07/21/2025
- File Size 0.6MB
- # of Slides 2
- File Format PPTX
- Slide Ratio 16:9
- Color
Keywords
About the Product
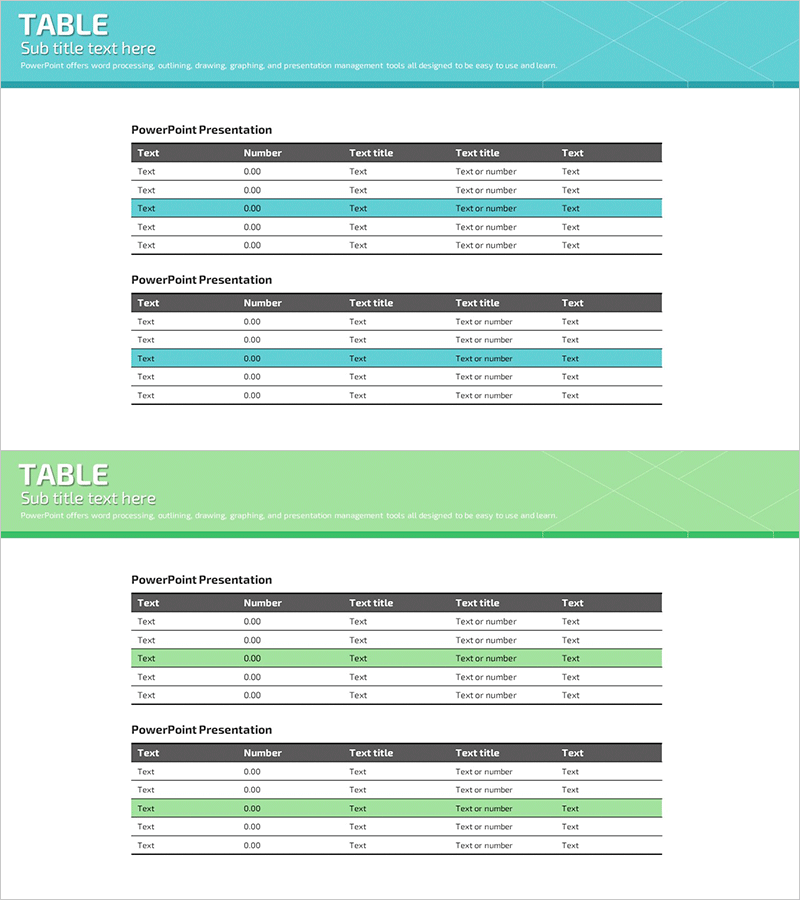
A professional table PowerPoint slide designed for presenting quantitative data, financial metrics, competitive analysis, and market comparisons. This slide deck features two color variations—turquoise and green backgrounds—each with a 5-column by 5-row data entry structure. The header row is emphasized with dark gray shading to distinguish column titles, while alternating row colors enhance readability and visual hierarchy. Numeric values, text entries, and percentage data can be easily compared across rows. The highlight row feature allows you to emphasize key metrics and critical data points. Perfect for business plans, marketing presentations, investor pitch decks, and quarterly business reports where data-driven insights are essential.
Usage Points
-
Main Usage
Present quantitative data and numerical information in a structured, easy-to-read table format. Visualize market data, financial performance, competitive benchmarks, and KPIs to support strategic decision-making and stakeholder communication.
-
How to Use
Enter text, numbers, and percentages into each cell to complete your data analysis. Choose between turquoise or green background based on your presentation theme and existing slide design. Use the highlight row feature to emphasize key metrics. Duplicate rows if additional data entries are needed beyond the standard 5-row layout.
-
Recommended For
Finance teams, marketing departments, strategy teams, and sales professionals presenting market analysis, financial reports, competitive positioning, and performance metrics. Suitable for business plans, investor presentations, marketing strategy decks, quarterly business reviews, and executive briefings.
-
Slide Structure
Two-slide set, each featuring a 5-column (Text, Number, Text title, Text title, Test) by 5-row data table. The header row uses dark gray background for emphasis, while data rows alternate between turquoise and green backgrounds for improved readability. All cells are optimized for text and numeric input with clear visual separation.
Related Products
-

America Map and Icon Sign – Effective Tool for Market Analysis
#Market and Competitor Analysis #Financial Plans and Performance #Diagram
-

Comprehensive Basis Analysis Chart – Market and Financial Performance Analysis
#Market and Competitor Analysis #Financial Plans and Performance #Diagram
-

Goal Setting & Radial Graph – Intuitive Data Visualization
#Business Introduction #Market and Competitor Analysis #Diagram
-

Construction Order Status Table – Optimal Choice for Business Analysis
#Business Management #Market and Competitor Analysis #Diagram
