Creative Science Experiment Overlapping Diagram – Strategic Marketing Use
RJ0700001_23
- Last Update 07/21/2025
- File Size 0.6MB
- # of Slides 2
- File Format PPTX
- Slide Ratio 16:9
- Color
Keywords
- #Content-Based Slides
- #Design-Based Slides
- #Business Vision and Strategy
- #Marketing Plan and Strategy
- #Diagram
- #Business Strategy
- #Marketing Strategy
- #Cluster
- #Combination Diagram
- #16:9
- #Venn diagram PowerPoint
- #overlapping diagram slide
- #intersection analysis
- #3-area Venn diagram
- #strategic analysis PowerPoint
- #business comparison slide
About the Product
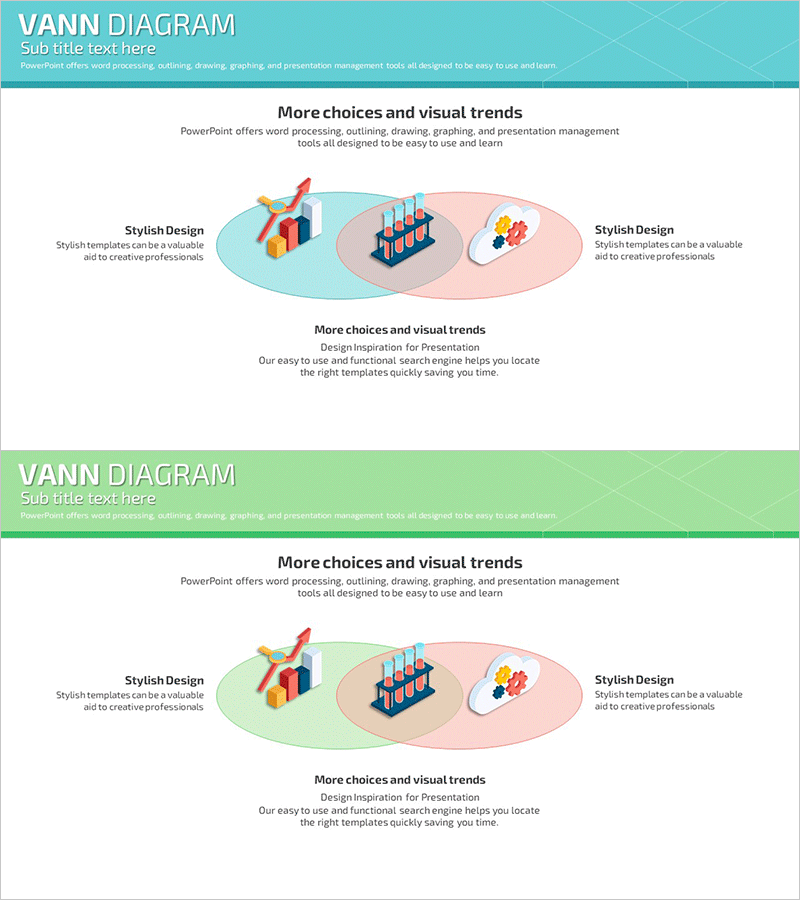
A three-area overlapping Venn diagram PowerPoint slide that visualizes intersections and relationships between concepts. The design features a soft color palette of turquoise, pink, and beige tones, making it ideal for strategic analysis, marketing positioning, and business domain comparison. With 2 slides in 16:9 format, you can instantly apply this diagram to various presentation scenarios. Each area supports flexible text and icon placement, allowing you to customize the content for your specific analysis needs. This diagram slide effectively communicates relationships and commonalities between concepts in professional presentations.
Usage Points
-
Main Usage
Visualize intersections and differences between three concepts, domains, or strategies for comparative analysis. Effectively communicate strategic positioning, business domain analysis, organizational role definition, and customer segmentation in business planning and decision-making presentations.
-
How to Use
Input strategic elements, department names, customer segments, or product characteristics into each circular area, and place key commonalities or core values in the intersection zones. Customize colors and text to match your corporate brand, and emphasize different areas progressively throughout your presentation flow.
-
Recommended For
Ideal for executives, strategy teams, marketing departments, and business development teams presenting strategic meetings, business plans, marketing proposals, and organizational analyses. Essential for consulting reports, investment pitch decks, new business proposals, and organizational restructuring presentations.
-
Slide Structure
Two-slide set with turquoise header background on the first slide featuring three overlapping circular areas in a Venn diagram layout, with 'Stylish Design' text zones on left and right sides. The second slide uses a green header background with identical structure, allowing multiple analysis examples to be presented sequentially.
Related Products
-

7P Marketing Overlay Diagram – Innovation in Business Strategy
#Business Vision and Strategy #Marketing Plan and Strategy #Diagram
-

Visualizing Business Strategies with Triangular Overlap and Nested Diagrams
#Business Vision and Strategy #Marketing Plan and Strategy #Diagram
-

Business Strategy Overlay Diagram – Effective Strategy Visualization
#Business Vision and Strategy #Marketing Plan and Strategy #Diagram
-

Chromosome Theme Business Strategy Diagram
#Business Vision and Strategy #Marketing Plan and Strategy #Diagram
