Target Market Analysis Bar Graph – Visualizing Market Strategies
RJ0700001_6
- Last Update 07/21/2025
- File Size 1.1MB
- # of Slides 2
- File Format PPTX
- Slide Ratio 16:9
- Color
Keywords
- #Content-Based Slides
- #Design-Based Slides
- #Market and Competitor Analysis
- #Marketing Plan and Strategy
- #Graph
- #Other
- #Target Market
- #Target Market Strategy
- #Horizontal Bar
- #Segmented Horizontal Bar
- #Map
- #16:9
- #stacked bar chart PowerPoint
- #market analysis slide template
- #time-series data visualization
- #horizontal bar graph download
- #world map slide design
About the Product
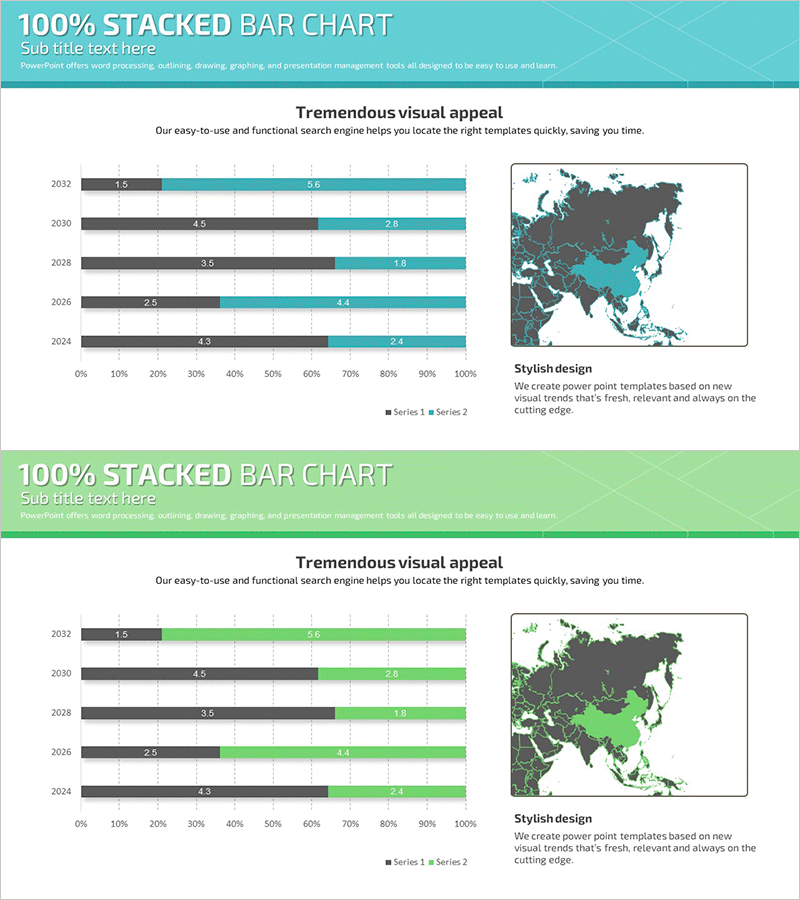
A stacked horizontal bar chart PowerPoint slide designed for target market analysis and strategic planning. This presentation template visualizes 6 years of market data (2024–2032) across 2 data series, enabling clear comparison of market composition and growth trends. The design features a turquoise and charcoal gray color scheme to distinguish data series, with an integrated world map on the right side representing global market scope. Ideal for business reports, marketing strategy presentations, and investor pitch decks where market size evolution and regional performance must be communicated simultaneously.
Usage Points
-
Main Usage
This stacked horizontal bar chart expresses both year-over-year market size changes and series-level proportions simultaneously. It supports strategic decision-making by clearly visualizing target market growth trajectories and compositional ratios during market strategy development phases.
-
How to Use
Deploy in the market analysis section of business reports, market overview segments of marketing strategy decks, and market opportunity explanations in investor pitch materials. The world map on the right emphasizes global market scope while the left-side graph presents quantitative data with labeled values for each bar segment.
-
Recommended For
Suitable for presentations to marketing teams, strategy planners, executives, and investors. Particularly effective for market entry strategies, business expansion plans, and quarterly or annual performance analysis where data credibility and visual clarity are essential.
-
Slide Structure
2-slide set with design variations. Slide 1 features a turquoise header; Slide 2 uses a lime green header. Each slide contains 6 years of stacked horizontal bars (2 series), a 0–100% horizontal axis, year labels (2024–2032), data value labels, and a world map insertion area on the right side.
Related Products
-

US Target Market Analysis Graph – Understanding Market Segmentation
#Market and Competitor Analysis #Marketing Plan and Strategy #Graph
-

Analysis of US Target Regions - Effective Market Exploration
#Market and Competitor Analysis #Marketing Plan and Strategy #Other
-

Asia-Focused Market Penetration Status - Data-Driven Market Analysis
#Market and Competitor Analysis #Marketing Plan and Strategy #Graph
-

Effective Slide Design for Analysis of Specific Regions in the U.S.
#Market and Competitor Analysis #Marketing Plan and Strategy #Other
