Country Regional Distribution Visualized by Circular Graph
RJ0700001_17
- Last Update 07/21/2025
- File Size 1.1MB
- # of Slides 2
- File Format PPTX
- Slide Ratio 16:9
- Color
Keywords
- #Content-Based Slides
- #Design-Based Slides
- #Company Introduction
- #Market and Competitor Analysis
- #Graph
- #Other
- #Global Network
- #Target Market
- #Circles
- #Doughnut Chart
- #16:9
- #world map PowerPoint slide
- #pie chart presentation
- #regional distribution visualization
- #global market analysis
- #country-by-country data
- #geographic data representation
About the Product
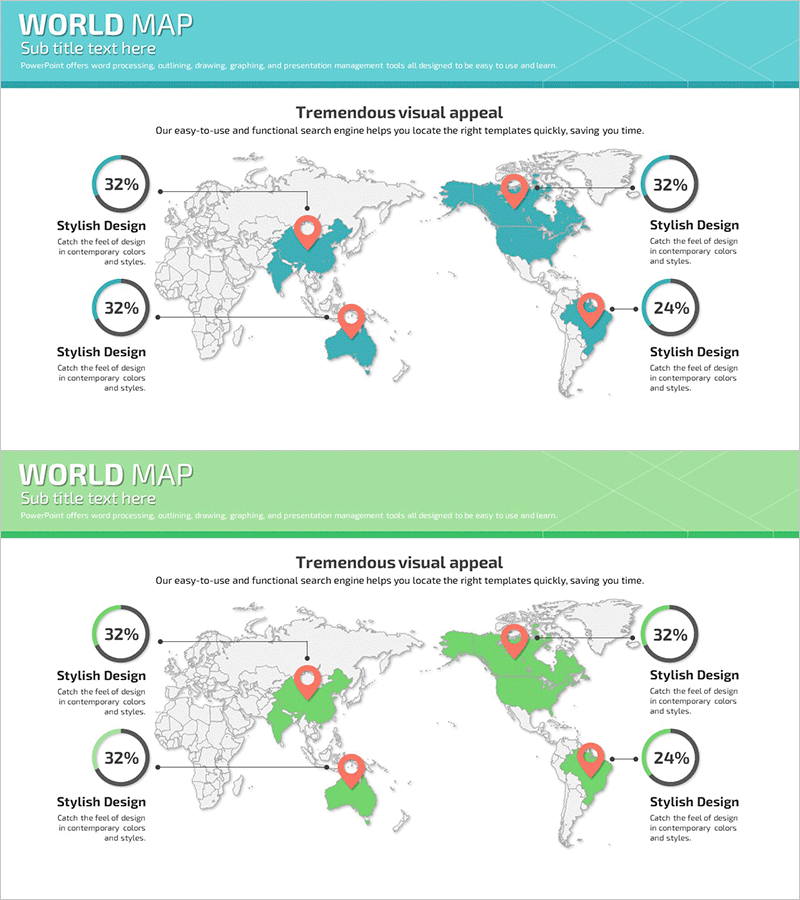
A PowerPoint slide combining a world map with pie chart visualization showing distribution across 4 global regions. The map uses teal and green color schemes to highlight different geographic areas, with corresponding pie charts displaying percentages (32%, 24%, etc.) for each region. Ideal for presenting international market analysis, country-by-country sales performance, regional customer distribution, and global business expansion. The 2-slide set includes color variations in teal and green tones, formatted in 16:9 widescreen for seamless presentation compatibility.
Usage Points
-
Main Usage
Visualize global market penetration, country-by-country revenue share, international customer distribution, and overseas business expansion across multiple regions simultaneously using integrated map and pie chart design.
-
How to Use
Insert into business plans, investment pitch decks, or marketing strategy presentations during market analysis sections. Customize the map regions by changing fill colors, edit pie chart percentages to reflect actual data, and modify text labels to match your specific geographic markets.
-
Recommended For
International business managers, global marketing teams, overseas sales directors, executive report writers, and investment relations professionals presenting geographic business performance and expansion strategies.
-
Slide Structure
Slide 1: Teal-toned world map with 4 highlighted regions plus 4 corresponding pie charts (32%, 32%, 32%, 24%) with text annotation areas. Slide 2: Identical layout in green color scheme for design variation. Both slides feature balanced composition between map and chart sections with editable text zones.
Related Products
-

Target Area Status Analysis Graph – Data and Insights
#Company Introduction #Market and Competitor Analysis #Graph
-

Donut Chart Visualizing Progress of Space Industry by Country
#Company Introduction #Market and Competitor Analysis #Graph
-

Global Target Market Analysis Map – Utilizing Visual Data
#Company Introduction #Market and Competitor Analysis #Graph
-

Analysis of Key Target Countries Slide - Market and Competitor Analysis
#Company Introduction #Market and Competitor Analysis #Graph
