Scientific Experiment History Diagram – Journey of Research and Innovation
RJ0700001_5
- Last Update 07/21/2025
- File Size 0.7MB
- # of Slides 2
- File Format PPTX
- Slide Ratio 16:9
- Color
Keywords
- #Content-Based Slides
- #Design-Based Slides
- #Company Introduction
- #Diagram
- #History
- #Flow
- #Cluster
- #Linear Flow
- #Chain Diagram
- #16:9
- #timeline diagram PowerPoint
- #history slide template
- #4-stage process diagram
- #research innovation timeline
- #scientific presentation slides
- #PowerPoint diagram slide design
About the Product
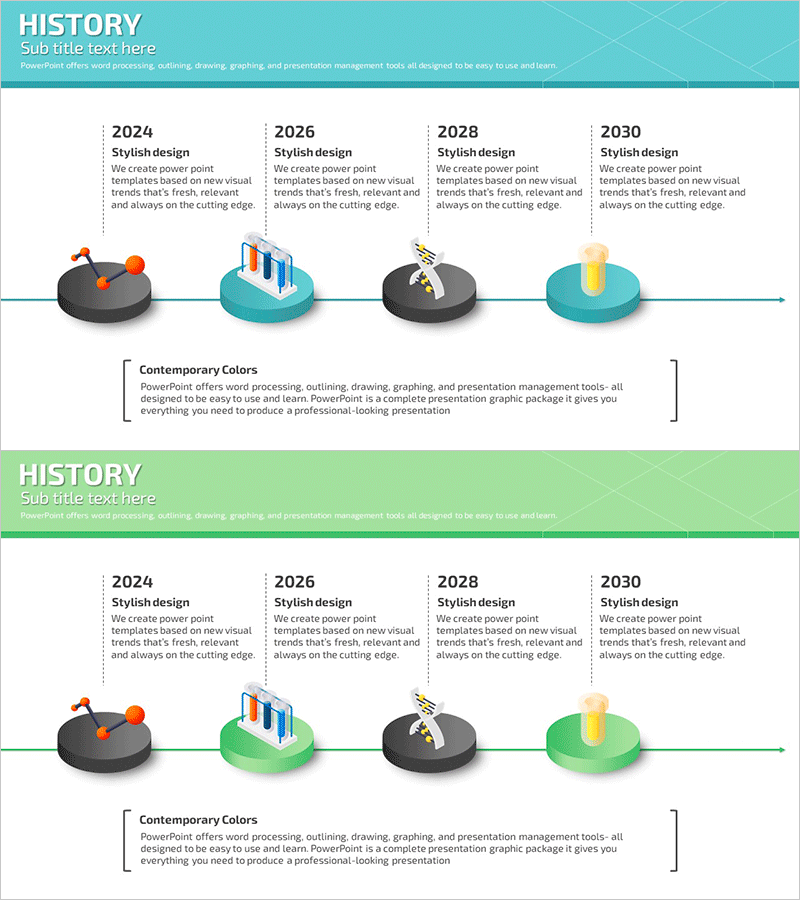
A timeline diagram PowerPoint slide that visualizes the journey of scientific research and innovation across time. This 2-slide set features four circular nodes connected in linear sequence with turquoise, black, and orange backgrounds. Each stage includes editable fields for year, title, and description text. The first slide uses a turquoise header while the second offers a lime-green variant for flexible design options. Ideal for presenting research project milestones, technology development roadmaps, scientific experiment progress, and innovation timelines in academic and corporate presentations.
Usage Points
-
Main Usage
Clearly visualize the chronological progression of scientific research projects, technology development roadmaps, and innovation processes. The four-node structure allows you to map key milestones, research phases, and achievements in a way that helps audiences understand project evolution intuitively.
-
How to Use
Enter the year and phase name in each circular node, then add detailed descriptions of major accomplishments and research activities in the text area below. Use the color-variant slides (turquoise and lime-green headers) to differentiate sections or create comparative presentations. Compatible with modern projectors in 16:9 widescreen format.
-
Recommended For
Ideal for scientists, researchers, and technology professionals presenting academic findings, university seminars, corporate R&D project status reports, new product development timelines, and science education materials.
-
Slide Structure
2-slide set. Each slide contains a header area with title text, a central timeline with 4 circular nodes and connecting lines, and a bottom text box for descriptions. Four editable input fields per node with color variants (turquoise and lime-green headers).
Related Products
-

History Gradient Diagram – Flow of Business Strategy
#Company Introduction #Business Strategy #Diagram
-

List of Studies by Year Slide – Business Strategy and Vision
#Company Introduction #Business Vision and Strategy #Diagram
-

Diagram Introducing the History of All Time – Business Growth and Development
#Company Introduction #Business Strategy #Diagram
-

Linear Flow Diagram for Propulsion Strategy Plan
#Company Introduction #Diagram #History
