Area Analysis Diagram
RJ0700001_8
- Last Update 07/21/2025
- File Size 0.6MB
- # of Slides 2
- File Format PPTX
- Slide Ratio 16:9
- Color
Keywords
About the Product
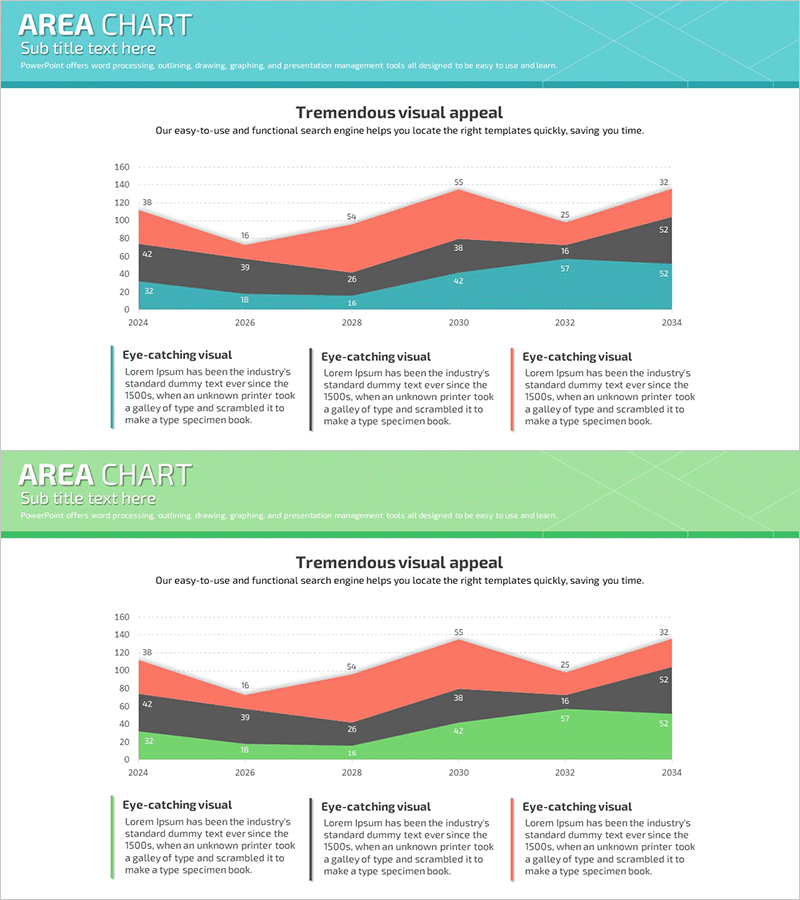
A stacked area chart PowerPoint slide that visualizes data changes across three series over time. The cumulative area chart uses three distinct colors—turquoise, gray, and coral—to differentiate each series, enabling simultaneous display of individual trends and total aggregates. Spanning from 2024 to 2034 with Y-axis scale (0–160) and X-axis year labels, this presentation template facilitates quantitative comparison. Ideal for business reports, analytical presentations, and data-driven documents where complex multi-series trends require clear visual communication.
Usage Points
-
Main Usage
Displays cumulative trends of multiple data series over time, comparing individual trajectories and overall magnitude changes simultaneously. Effectively communicates relationships between data sets and shifts in proportional composition, making complex multi-dimensional data accessible at a glance.
-
How to Use
Apply to business performance analysis, market size trends, revenue composition changes, and customer segment growth comparisons. Edit embedded values to match your data and apply immediately; adjust colors to align with brand guidelines. Fully editable for custom data integration.
-
Recommended For
Executive reports, quarterly and annual performance presentations, marketing analytics, investor pitch decks, and consulting proposals. Particularly valuable for finance, sales, marketing, and strategy departments requiring quantitative data visualization in high-stakes presentations.
-
Slide Structure
Two-slide set. First slide features turquoise header with 3-series stacked area chart (2024–2034, Y-axis 0–160, three color-coded series). Second slide includes lime-green header with identical chart structure. Both slides include three legend items (Eye-catching visual) and descriptive text areas at bottom.
Related Products
-

Regional Competitive Advantage Chart – Essential Tool for Market and Competitor Analysis
#Company Introduction #Market and Competitor Analysis #Graph
-

Target Area Status Analysis Graph – Data and Insights
#Company Introduction #Market and Competitor Analysis #Graph
-

User Analysis Graph by Age Group – Advanced Data Insights
#Market and Competitor Analysis #Diagram #Graph
-

Spring Pastel Wide PowerPoint Template Mockup&Donut Chart
#Product/Service Introduction #Marketing Plan and Strategy #Graph
