Introduction to the Science Experiment Program – Linear Flow Diagram
RJ0700001_20
- Last Update 07/21/2025
- File Size 1.1MB
- # of Slides 2
- File Format PPTX
- Slide Ratio 16:9
- Color
Keywords
- #Content-Based Slides
- #Design-Based Slides
- #Product/Service Introduction
- #Marketing Plan and Strategy
- #Diagram
- #Program Introduction
- #Marketing Objectives
- #Flow
- #Linear Flow
- #16:9
- #linear diagram PowerPoint
- #3-step flow chart slide
- #process diagram template
- #arrow diagram PPT
- #science experiment program introduction slide
- #marketing strategy diagram PowerPoint
About the Product
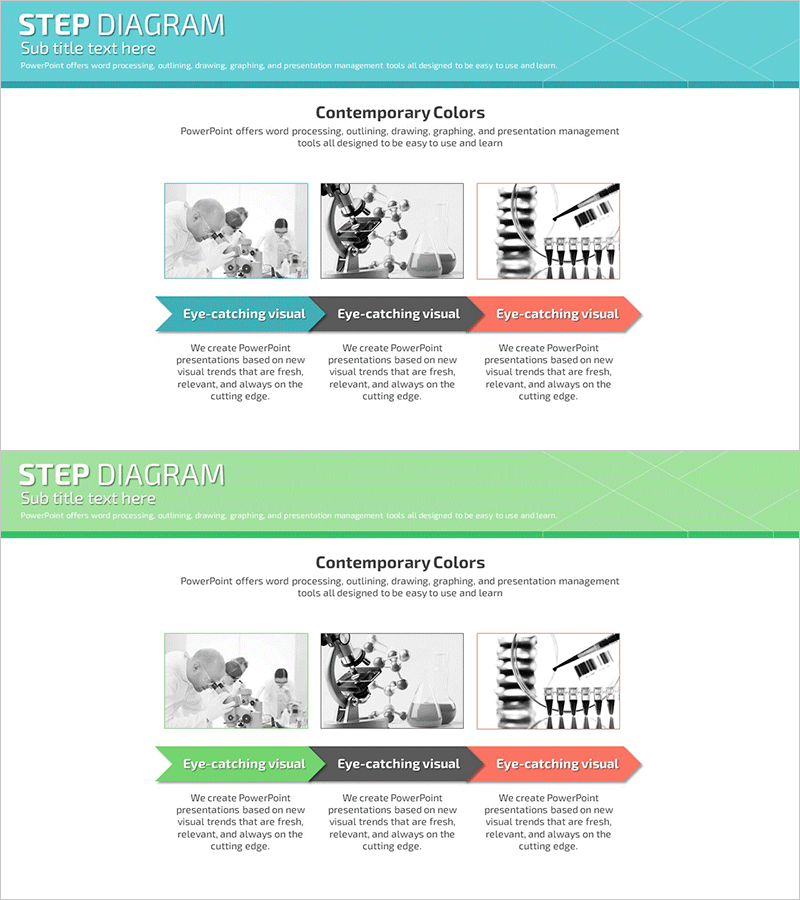
A linear flow diagram PowerPoint slide optimized for science experiment program introductions, marketing strategy presentations, and educational content. The left-to-right progression features three arrow-shaped nodes that clearly express process stages, chronological sequences, and cause-and-effect relationships. The turquoise header combined with green accent colors and black-and-white image areas creates a contemporary and professional atmosphere. With 2 slides included, diverse content layouts are possible, and clearly separated text and image zones enable immediate editing and deployment.
Usage Points
-
Main Usage
A linear flow diagram that expresses process stages, chronological sequences, and cause-and-effect relationships through arrow-shaped nodes progressing left to right. Visually represents step-by-step progression of science experiment programs, execution order of marketing campaigns, and learning stages of educational curricula.
-
How to Use
Enter title and description text in each stage node, and insert representative photos or graphs in the image areas. Maintain the turquoise and green color scheme while modifying only text content to apply the template to various process explanations. The 2-slide structure allows continuous representation of multiple processes.
-
Recommended For
Science and education instructors, marketing professionals, project managers, corporate training coordinators, product development teams, and consultants explaining step-by-step processes, implementation plans, and learning pathways. Suitable for academic presentations, corporate briefings, educational seminars, and strategy meetings.
-
Slide Structure
2-slide composition. Each slide features a turquoise header area at the top (title zone), three arrow-shaped nodes in the center (text input available in each node), and three image areas at the bottom (for inserting black-and-white photos or graphs). Arrows connecting the nodes emphasize the linear flow.
Related Products
-

Infant Content Introduction Infographic – Clear Presentation Slide
#Product/Service Introduction #Business Management #Diagram
-

Linear Diagram Slide for Boat Package Promotion
#Product/Service Introduction #Marketing Plan and Strategy #Diagram
-

Cloud Smart System Target Revenue Setting – Marketing Strategy and Financial Performance
#Marketing Plan and Strategy #Financial Plans and Performance #Diagram
-

Setting AI Business Goals – Trust and Innovation in Presentation
#Product/Service Introduction #Marketing Plan and Strategy #Program Introduction
