Scientific Experiment Process Cycle Diagram – Effective Business Introduction
RJ0700001_12
- Last Update 07/21/2025
- File Size 0.6MB
- # of Slides 2
- File Format PPTX
- Slide Ratio 16:9
- Color
Keywords
- #Content-Based Slides
- #Design-Based Slides
- #Business Introduction
- #Operational Plan
- #Diagram
- #Business Areas
- #Business Processes
- #Flow
- #Circular Flow
- #16:9
- #circular diagram PowerPoint
- #4-direction diagram slide
- #process flow PowerPoint template
- #cycle diagram presentation
- #radial diagram slide
- #business process diagram download
About the Product
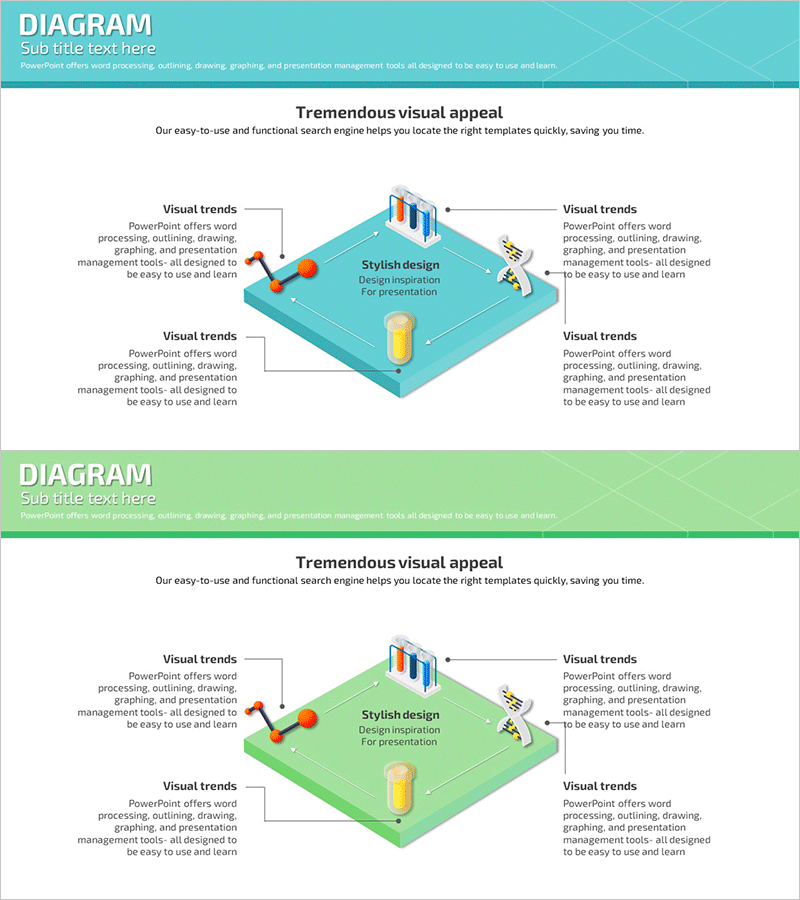
A circular diagram PowerPoint slide with four directional flows radiating from a central core element. The turquoise blue and lime green dual-tone color scheme creates strong visual contrast, with icons, text, and description areas positioned in each direction to intuitively represent process flows, cycles, and interdependencies. The 2-slide set is ready for immediate use in diverse presentation contexts, optimized for explaining scientific processes, technology workflows, and business operations.
Usage Points
-
Main Usage
Visualizes process flows, cycles, and interdependencies radiating from a central concept in four directions. Ideal for illustrating scientific experiment stages, business operation workflows, marketing cycles, inter-departmental collaboration structures, and information flow relationships across multiple contexts.
-
How to Use
Enter your core topic in the central text area and populate each of the four directional sections with stages, elements, or roles. The arrows and icons guide visual flow, so presenting from the center outward to each direction enhances audience comprehension. Colors, text, and icons are fully editable to match your brand.
-
Recommended For
Research presentations in science and technology fields, operations process sections in business plans, campaign cycle explanations in marketing proposals, organizational collaboration structures in HR presentations, and learning stage representations in educational seminars.
-
Slide Structure
2-slide set. Each slide features a central circular element with text boxes, icons, and description areas positioned in four cardinal directions (top, bottom, left, right). Turquoise and lime green tones differentiate directional sections, while arrows and connector lines emphasize the circular flow pattern.
Related Products
-

Mobile Finance Process Cycle Diagram
#Business Introduction #Operational Plan #Diagram
-

Healthcare System Process Diagram – Efficient Workflow
#Business Introduction #Operational Plan #Diagram
-

Online Shopping Mall Delivery Process Diagram – Visual Enhancement for Operational Efficiency
#Business Introduction #Operational Plan #Diagram
-

Camping Product Quality Assurance Plan Slide
#Operational Plan #Diagram #Business Processes
