Competitive Advantage Bar Graph – Market and Competitor Analysis
RJ0700001_13
- Last Update 07/21/2025
- File Size 0.6MB
- # of Slides 2
- File Format PPTX
- Slide Ratio 16:9
- Color
Keywords
- #Content-Based Slides
- #Design-Based Slides
- #Market and Competitor Analysis
- #Graph
- #Competitor Analysis
- #Competitive Advantage
- #Horizontal Bar
- #Double Horizontal Bar
- #16:9
- #horizontal bar chart PowerPoint
- #dual comparison chart template
- #competitive analysis slide
- #market comparison graph
- #how to create bar chart in PowerPoint
About the Product
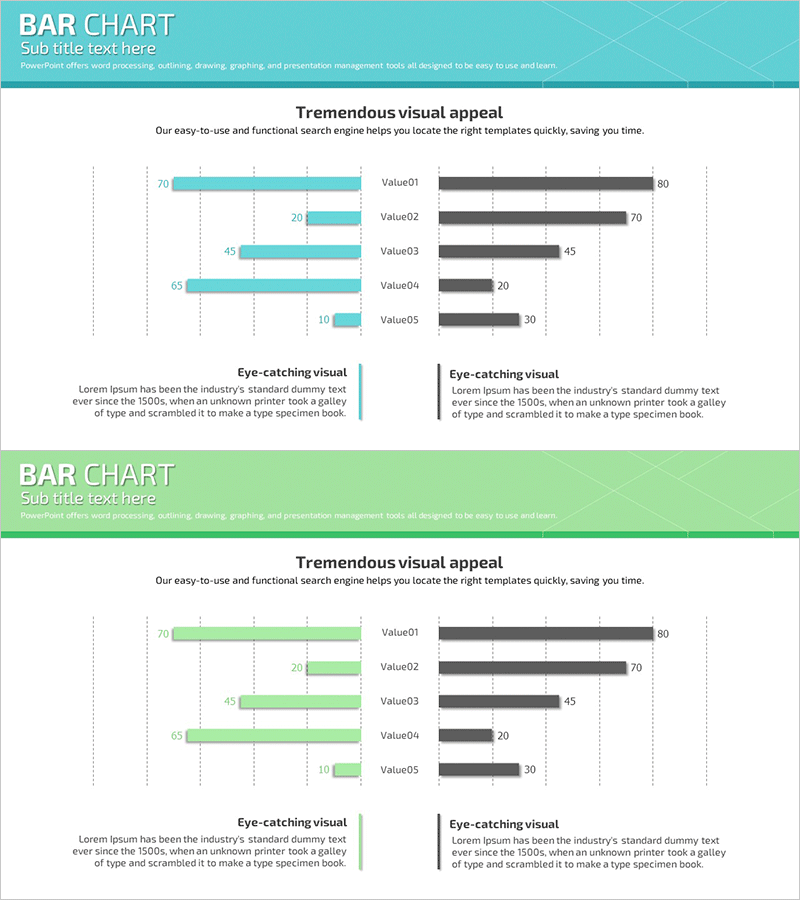
A horizontal bar chart PowerPoint slide optimized for competitive advantage analysis and market comparison. This presentation template features five items displayed with contrasting teal and gray bars on the left and right sides, enabling intuitive visualization of competitive positioning. The 16:9 widescreen format includes 2 slides ready for immediate use in marketing plans, business proposals, and executive reports. Fully editable to accommodate your specific data and presentation context.
Usage Points
-
Main Usage
Display competitive advantage by comparing your company's metrics against competitors across five key dimensions. The contrasting bar lengths instantly reveal competitive strengths, making it ideal for comparing market share, customer satisfaction, pricing power, and other performance indicators.
-
How to Use
Replace Value01 through Value05 labels and numbers with your actual data. Input your company metrics in the teal bars and competitor data in the gray bars, then update the title and legend to match your presentation narrative. All elements are fully editable in PowerPoint.
-
Recommended For
Marketing managers, strategy planners, and executives presenting competitive analysis to stakeholders, investors, and clients. Suitable for business proposals, marketing strategy presentations, quarterly business reviews, and investor pitch decks.
-
Slide Structure
Two-slide layout featuring 5-item horizontal bar charts with teal bars on the left and gray bars on the right. Each item includes numerical labels and a clear legend. The symmetric arrangement enables direct visual comparison between paired data series.
Related Products
-

Competitive Comparison Analysis Bar Graph – Visualizing Market Advantage
#Market and Competitor Analysis #Graph #Competitor Analysis
-

Horizontal Bar Chart for Beer Competitive Advantage Visualization
#Market and Competitor Analysis #Graph #Competitor Analysis
-

Competitor Paired Bar Graph – Market Analysis and Comparison
#Market and Competitor Analysis #Graph #Competitor Analysis
-

Sailing Travel Service Company and Competitor Analysis Dual Horizontal Chart
#Market and Competitor Analysis #Graph #Competitor Analysis
