
Virus PowerPoint Template – Modern and Professional Design
J0700007
- Last Update 01/10/2025
- File Size 35.8MB
- # of Slides 30
- File Format PPTX
- Slide Ratio 16:9
- Color
Slide Preview


Keywords
About the Product
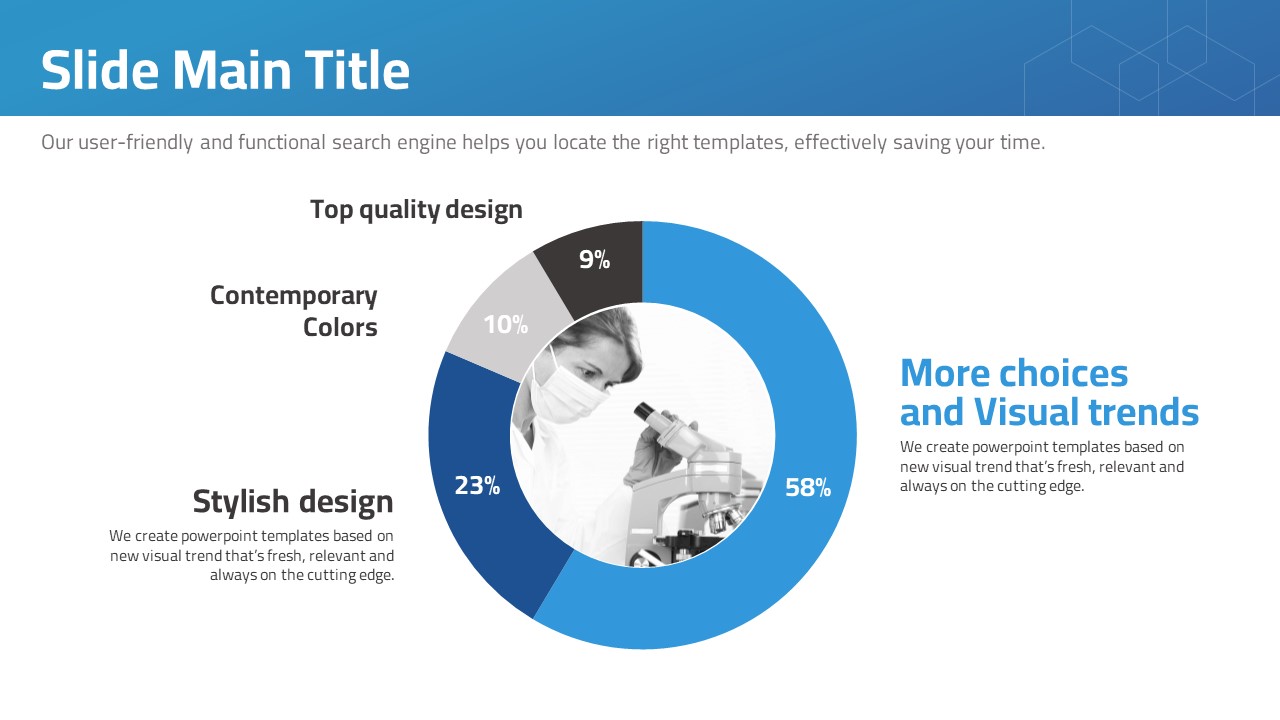
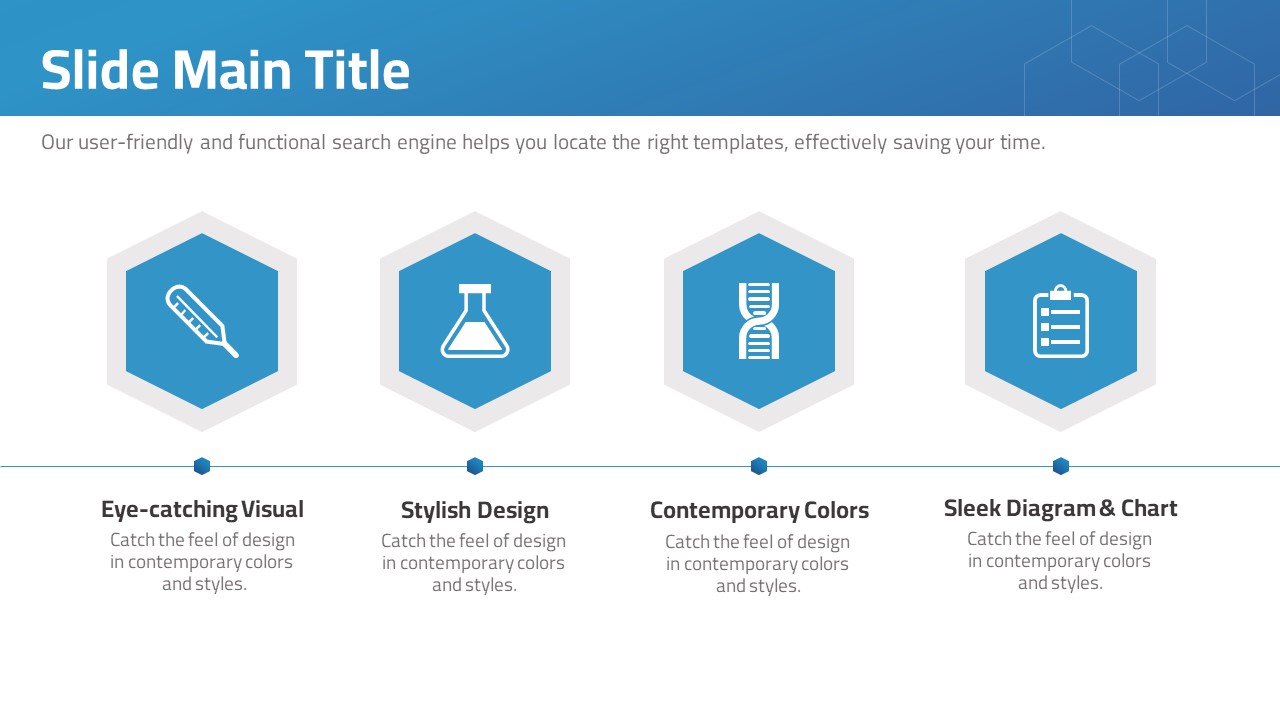
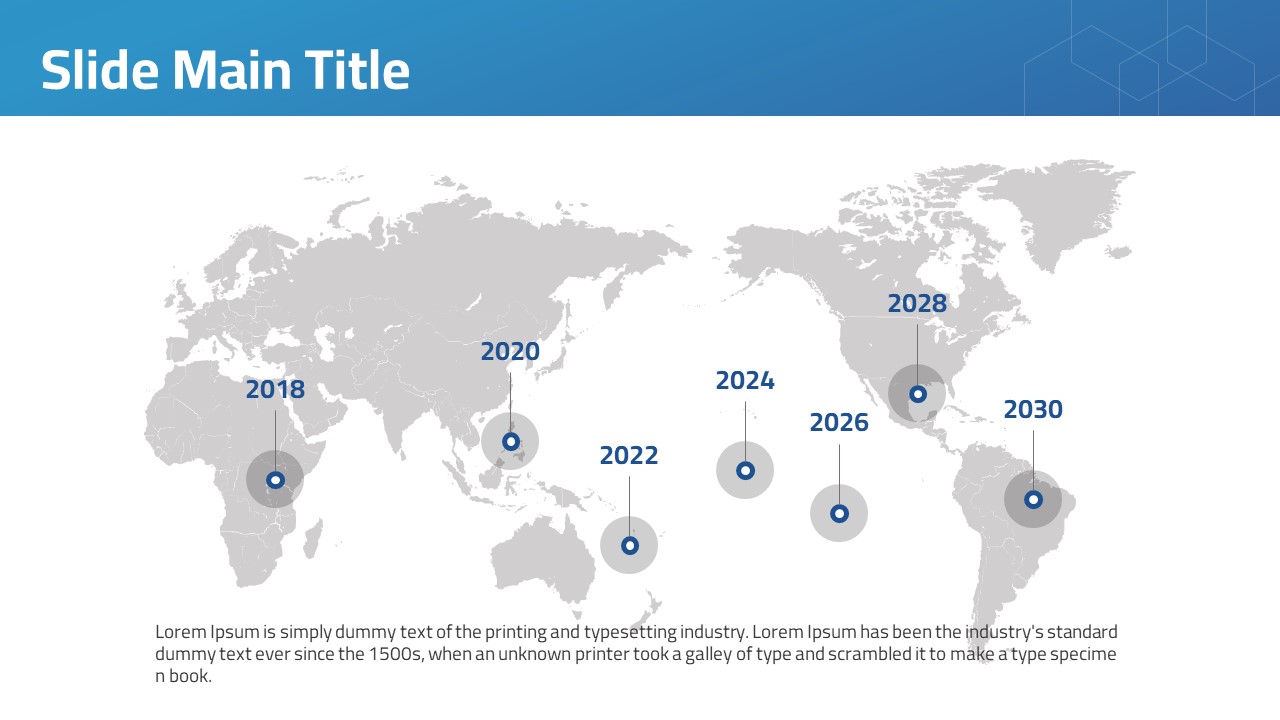
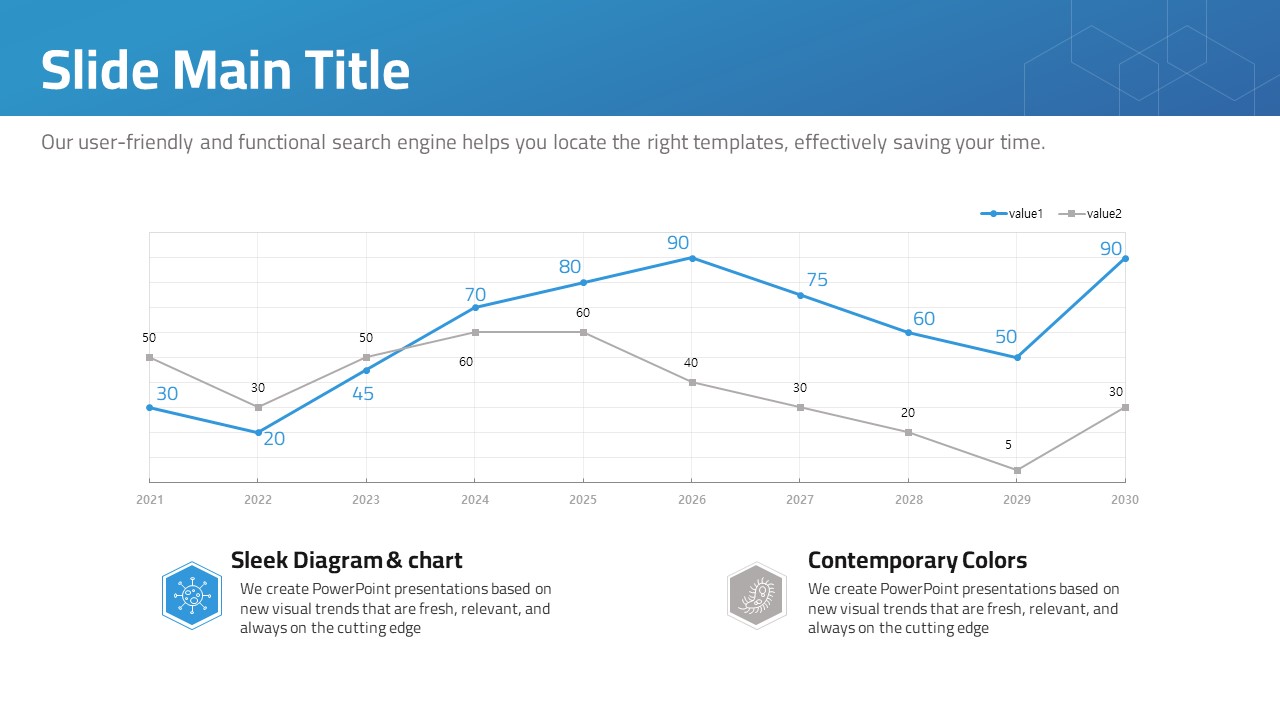
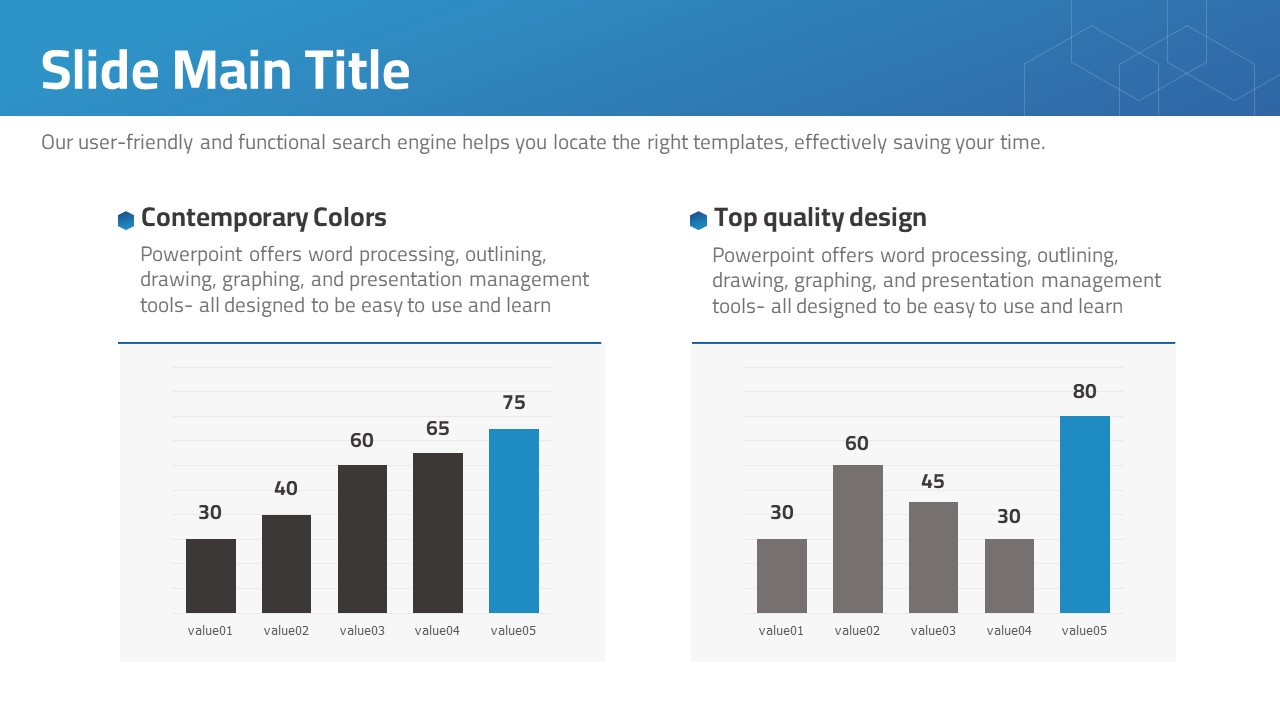
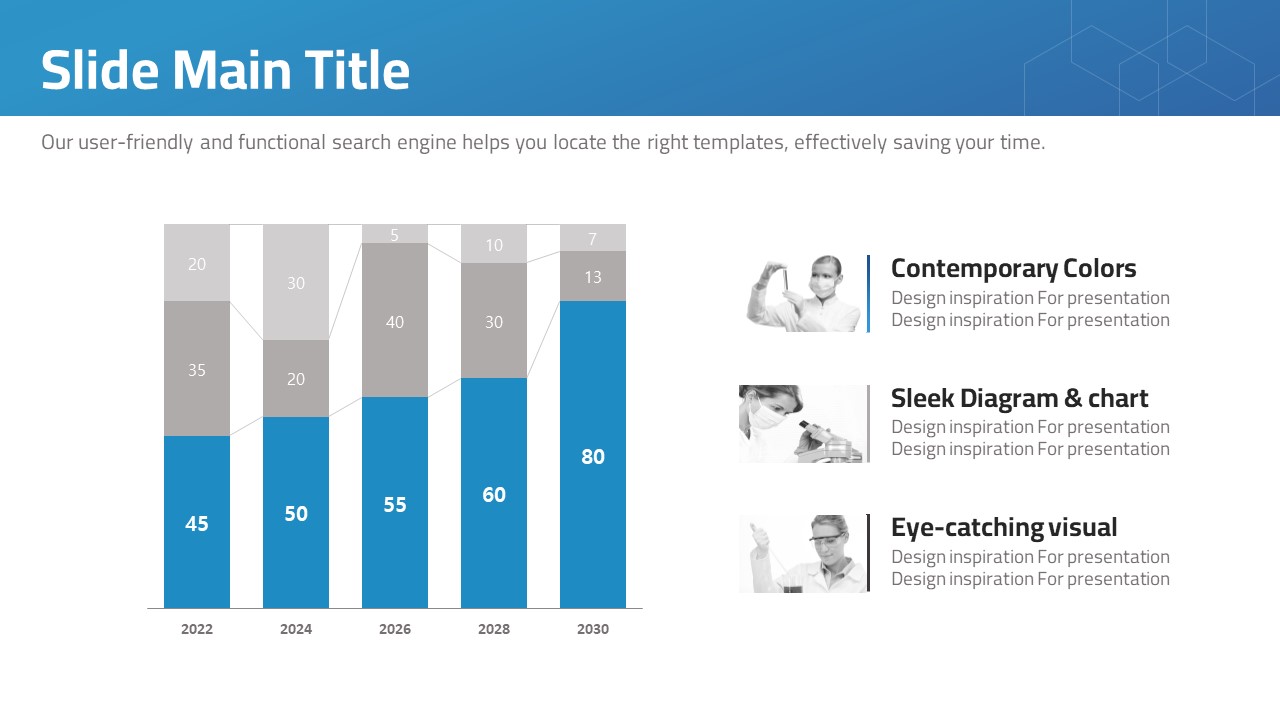
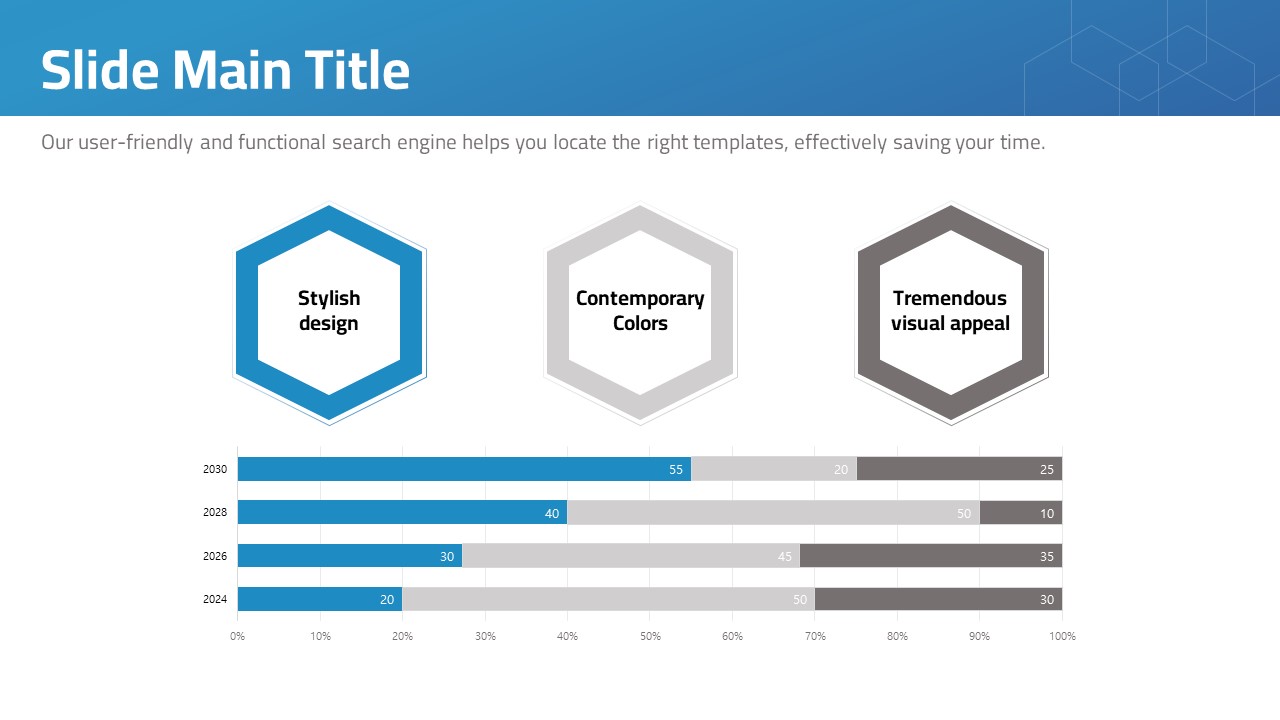
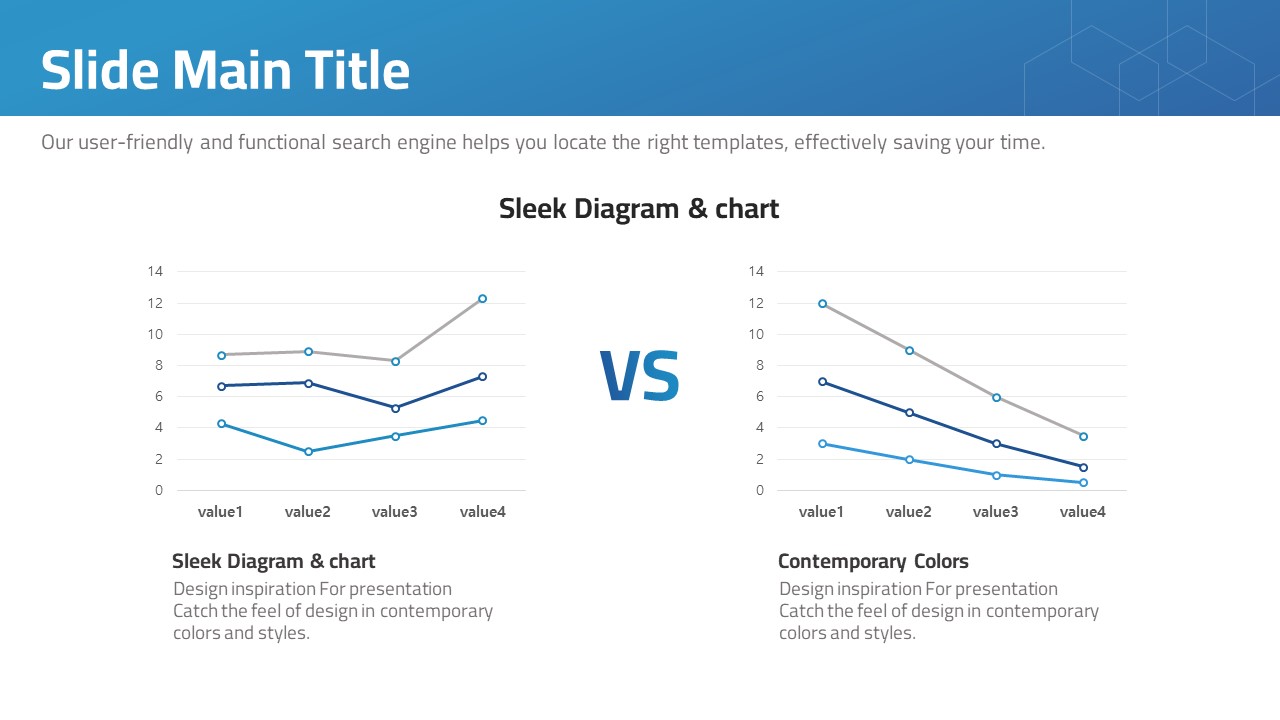
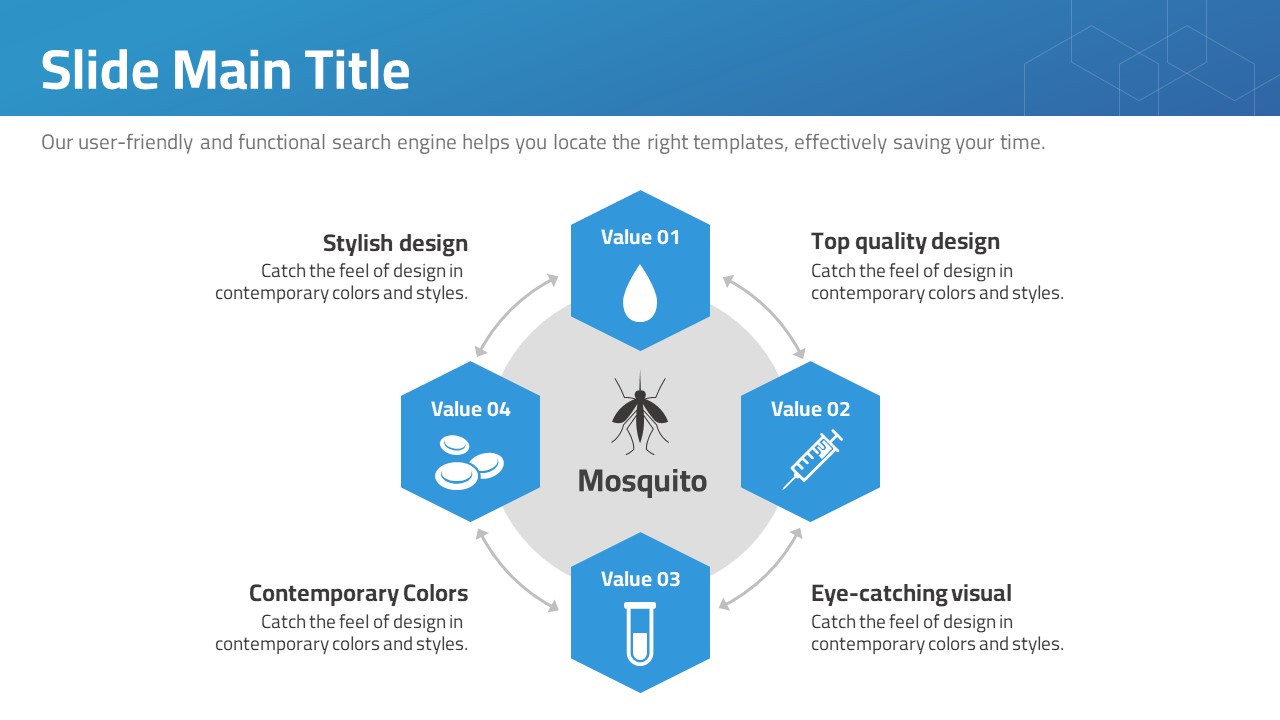
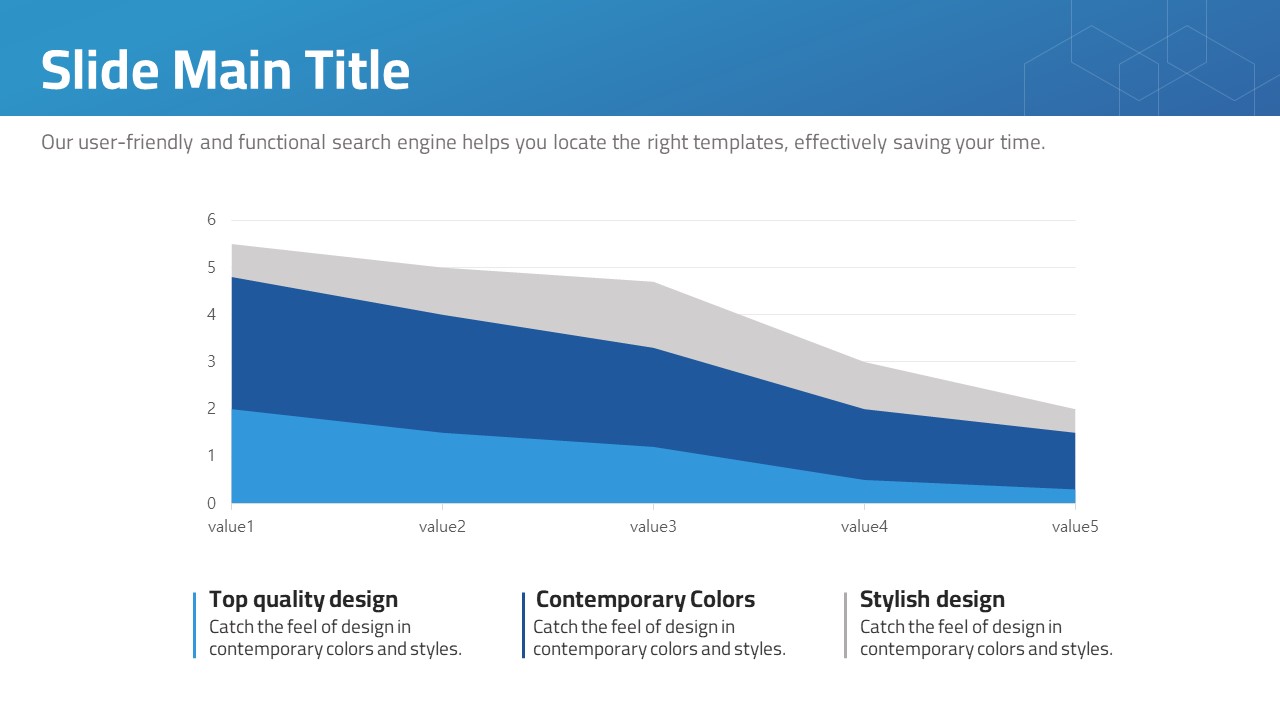
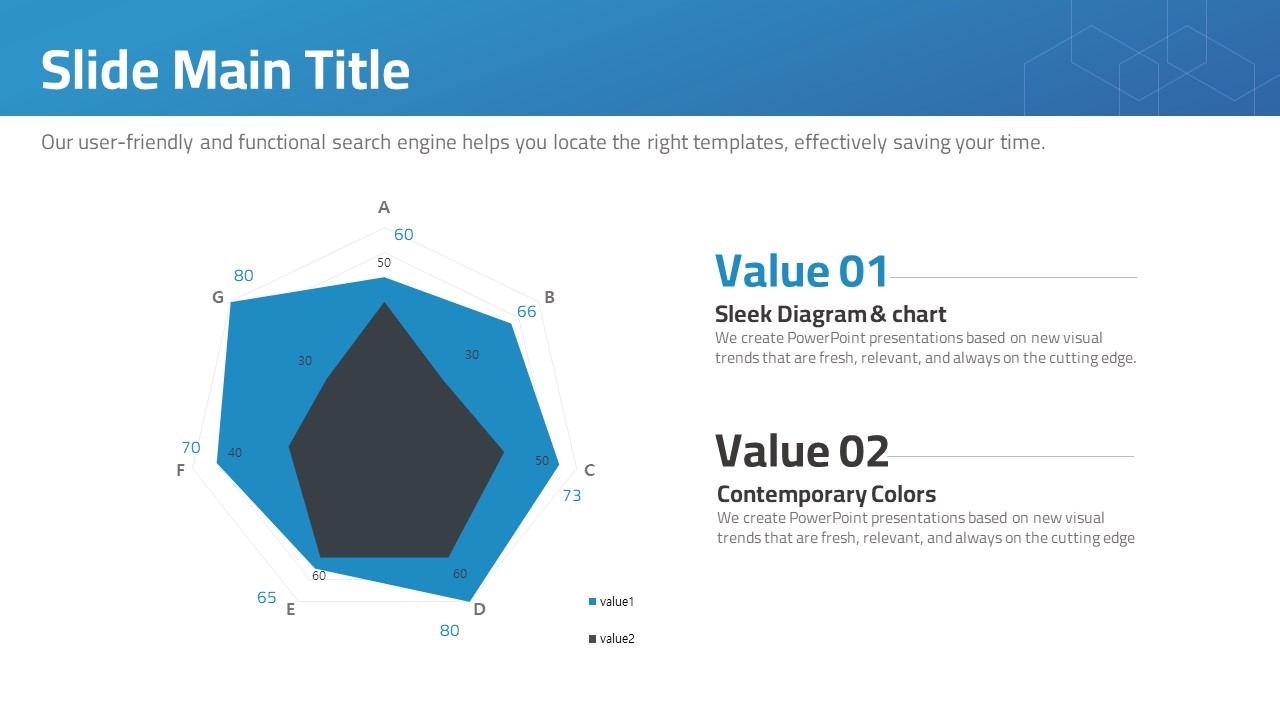
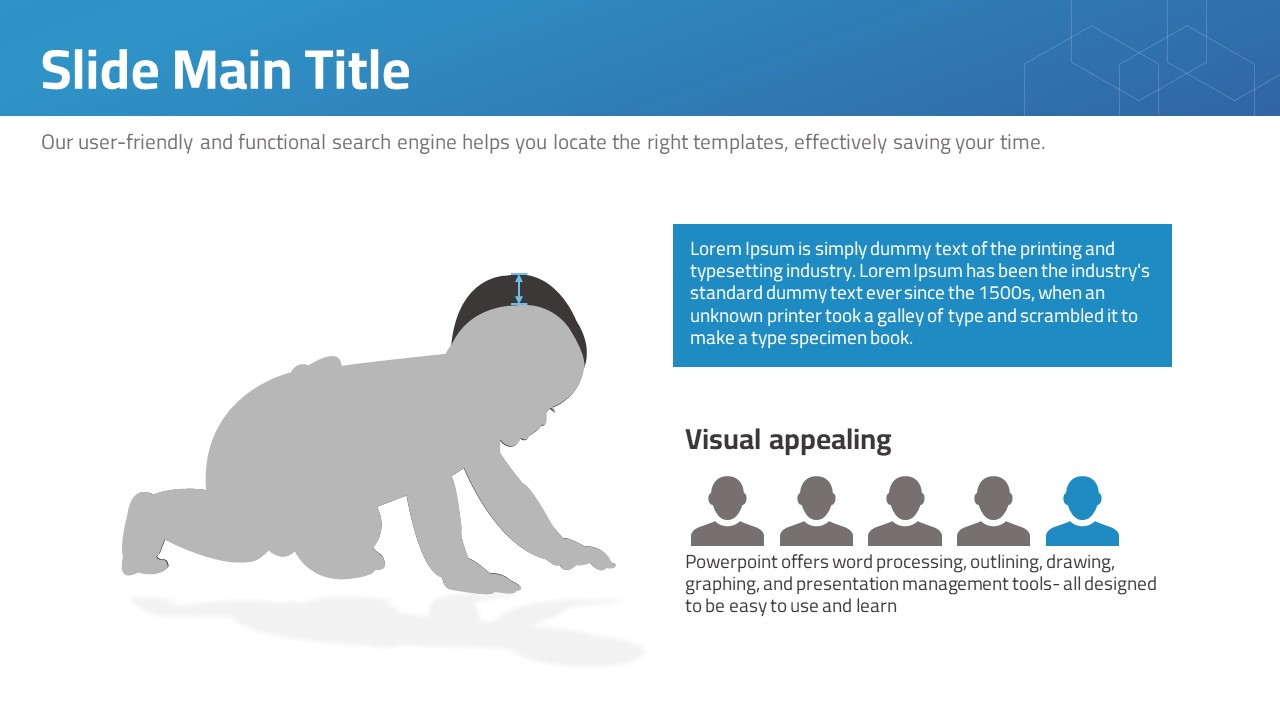
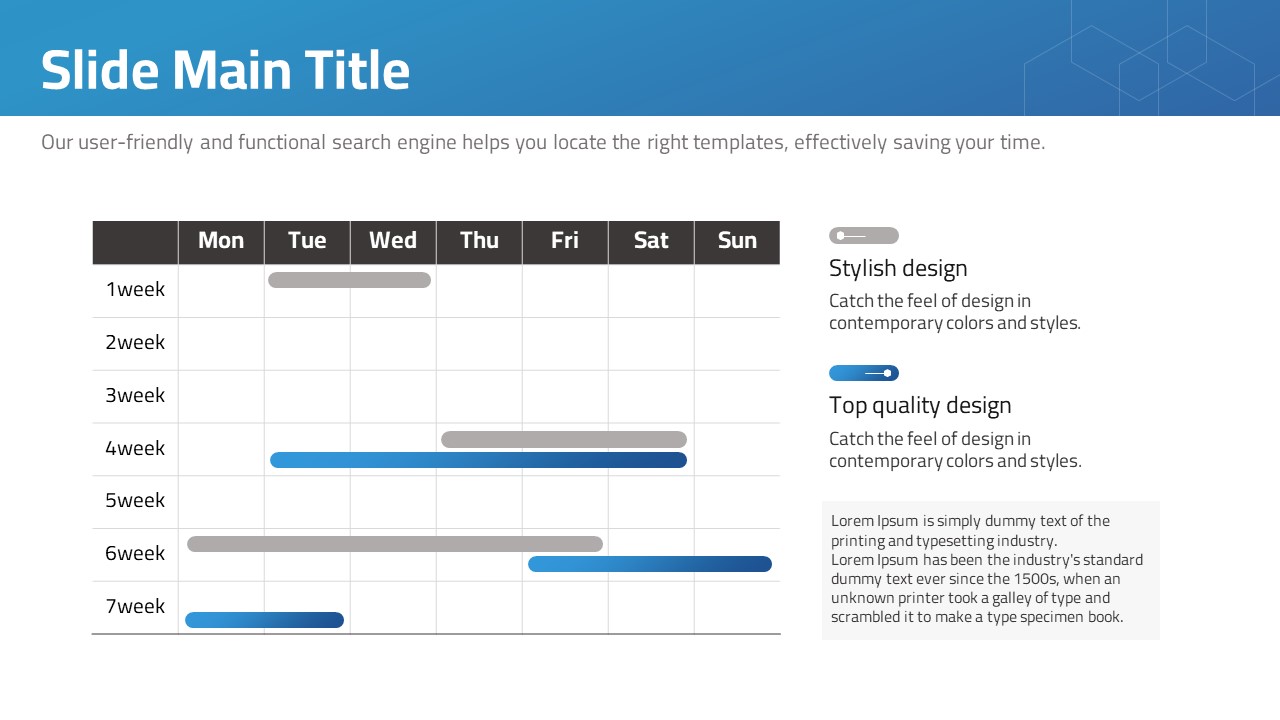
A professional PowerPoint template set of 30 slides designed for presentations on viruses, infectious diseases, and public health topics. The template features a deep blue color scheme paired with white hexagon icons, delivering a clean and authoritative look suited to medical and scientific audiences. The title slide uses a full-bleed blue background with a mosquito target icon to immediately communicate the subject matter. Body slides include a two-column icon grid layout, radial diagrams, a dual-line trend chart spanning 2021–2030, and a honeycomb arrangement of 10 medical icons—heart rate, thermometer, doctor, syringe, IV drip, ambulance, DNA, flask, checklist, and pills. Data visualization slides such as comparison tables and percentage bar charts are also included, making it easy to present research findings and statistics. All elements are fully editable in PPTX format, allowing you to customize text, colors, and icons without additional design work. Ideal for epidemiology reports, public health campaign slides, medical academic presentations, and healthcare organization briefings.
Usage Points
-
Main Usage
Designed for medical researchers, public health professionals, and healthcare organizations presenting on virus outbreaks, infectious disease data, or health campaign initiatives. The deep blue hexagon design conveys scientific credibility and institutional authority.
-
How to Use
Open the PPTX file and replace placeholder text on the title, body, and data slides. Hexagon icons and text boxes are individually editable. Update the dual-line trend chart and comparison table directly with your own research data or statistics.
-
Recommended For
Recommended for epidemiologists, public health officers, medical academics, healthcare policy planners, and hospital communications teams. Also suitable for science educators and NGO health campaign coordinators who need a credible, data-ready slide deck.
-
Slide Structure
30 slides total: full-bleed blue title slide with mosquito target icon, two-column hexagon icon body slides, radial diagram, 2021–2030 dual-line trend chart, 10-icon honeycomb medical layout, data comparison table, and percentage bar chart slides.
Related Products
-

Robot PPT Wide Template – Innovative Design and Efficiency
#Science/Medical
-

Rocket Presentation Wide Template – Sleek and Intuitive Design
#Science/Medical
-

Plastic Surgery Presentation Template – Professional Visual Representation
#Science/Medical
-

Chemistry Lab Presentation Template - Eye-Catching Visual Design
#Science/Medical
