3D Bar Chart Bundle – Market and Competition Analysis
RJ0700001_26
- Last Update 07/21/2025
- File Size 0.6MB
- # of Slides 2
- File Format PPTX
- Slide Ratio 16:9
- Color
Keywords
- #Content-Based Slides
- #Design-Based Slides
- #Market and Competitor Analysis
- #Graph
- #Competitor Analysis
- #Column
- #Grouped Column
- #16:9
- #3D clustered column chart PowerPoint
- #dual series bar chart slide
- #market analysis presentation
- #competitive comparison chart
- #data visualization PowerPoint template
- #how to create clustered column chart in PowerPoint
About the Product
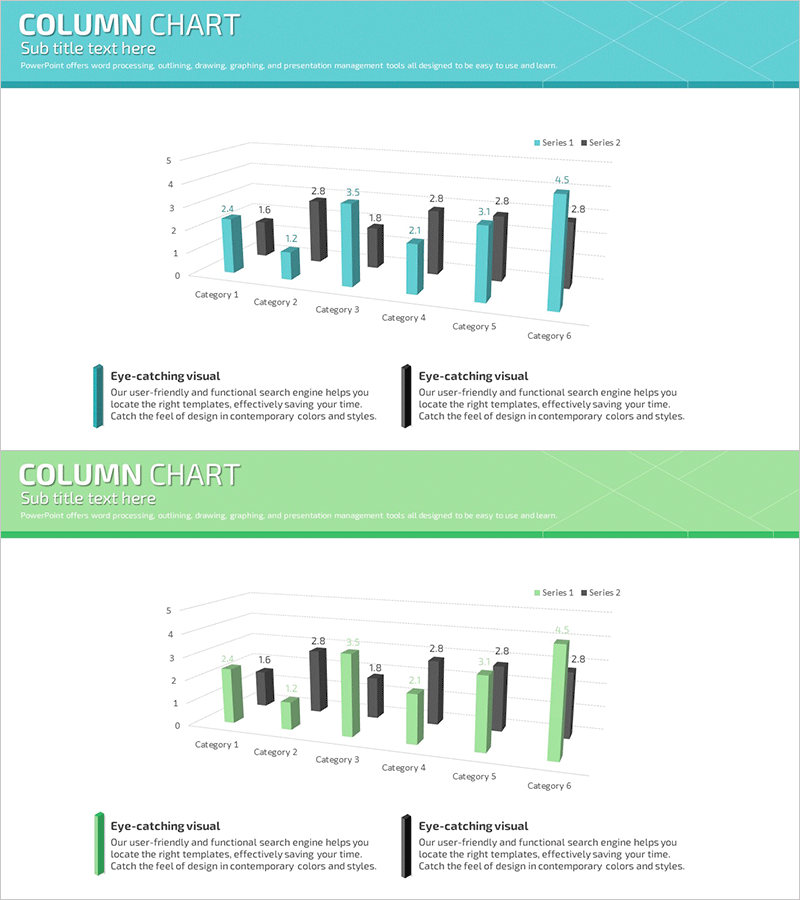
A 3D clustered column chart PowerPoint slide optimized for market analysis and competitive comparison. This presentation template displays two data series across six categories, enabling clear numerical comparison and trend analysis. The teal and charcoal color scheme provides strong visual contrast between data sets, while the 3D effect enhances the visual impact of your presentation. Ideal for business reports, marketing plans, sales presentations, and competitive analysis decks. Fully editable and ready to download for immediate use in your PowerPoint presentations.
Usage Points
-
Main Usage
Compare two data series across six categories such as market size, competitor performance, departmental results, or quarterly metrics. The 3D column design emphasizes data differences and makes numerical comparisons immediately clear to your audience.
-
How to Use
Enter your Series 1 and Series 2 data values for each of the six categories. The chart automatically displays paired 3D columns with value labels on top. Customize colors, category names, and data values directly in PowerPoint to match your presentation content.
-
Recommended For
Executive reports, business plans, marketing presentations, quarterly performance reviews, competitive analysis documents, and investor pitch decks. Ideal for strategists, business analysts, sales managers, marketing professionals, and data-driven presenters.
-
Slide Structure
Two-slide template. First slide features teal header with 6-category clustered 3D column chart and two text boxes below. Second slide uses lime green header with identical chart structure. Both slides include legend indicators for Series 1 and Series 2.
Related Products
-

PC Mockup & Column Bundle Graph
#Market and Competitor Analysis #Graph #Other
-

Botanic Garden Management Bundled Graph – Market and Performance Analysis
#Market and Competitor Analysis #Financial Plans and Performance #Graph
-

Competitor Analysis by Year Bundled Graph – Market Trend Insights
#Market and Competitor Analysis #Diagram #Graph
-

Analyzing 2 Comparison Graphs - Slides for Deriving Competitive Advantage
#Market and Competitor Analysis #Graph #Competitor Analysis
