Science Experiment Cycle Diagram – Creative Approach
RJ0700001_27
- Last Update 07/21/2025
- File Size 0.6MB
- # of Slides 2
- File Format PPTX
- Slide Ratio 16:9
- Color
Keywords
About the Product
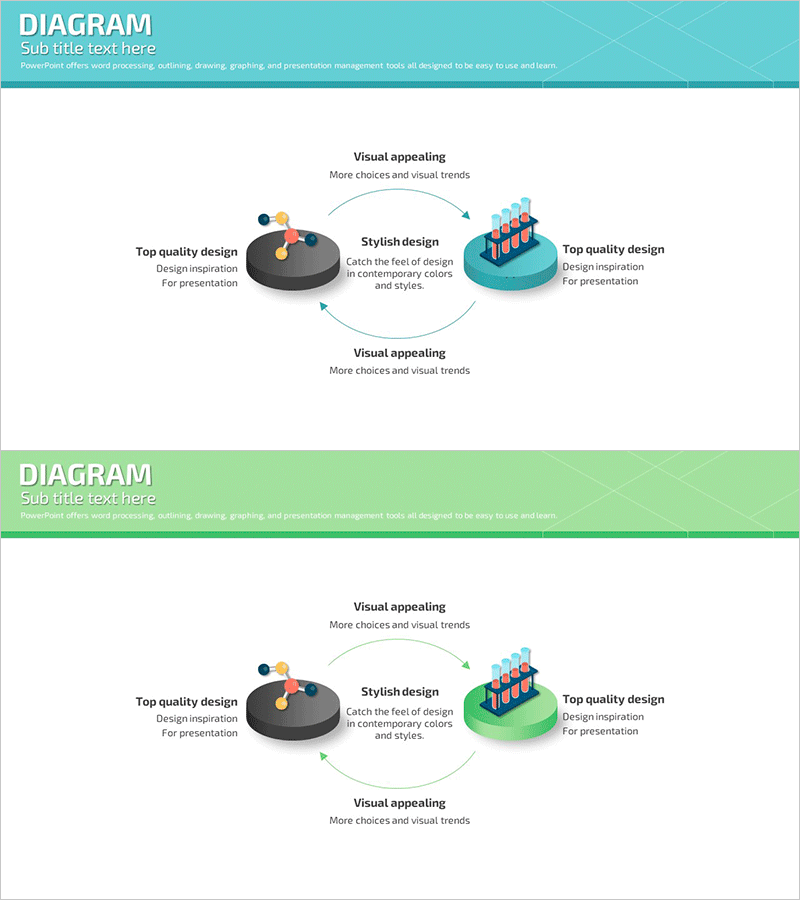
A PowerPoint slide that visualizes the iterative process of scientific experiments using a 3-node circular diagram structure. The central concept is connected to a dark gray node on the left and a turquoise node on the right via directional arrows, creating a clear cyclical flow. Each node includes descriptive text and icons for intuitive step-by-step communication. The 2-slide set features turquoise and lime green header backgrounds, ready for immediate use in presentations and educational materials. This diagram PowerPoint is highly effective for explaining cycles, iterative processes, and circular workflows in your presentations.
Usage Points
-
Main Usage
Optimized for visualizing repetitive and cyclical processes in scientific experiments, business strategy, and product development. The structure clearly represents a cycle starting from a central concept, progressing through left and right stages, and returning to the center, making it ideal for educational presentations, research talks, and strategic business planning.
-
How to Use
Enter text and icons into each node to describe the stages. Place the core concept in the central dark gray node, the first stage in the left node, and the second stage in the right turquoise node, then follow the arrow directions to explain the circular flow. Colors and icons are fully editable to match your presentation theme.
-
Recommended For
Recommended for science educators, researchers, business strategists, product development teams, and marketing professionals explaining process flows. Particularly suited for experimental procedures, quality management cycles, marketing funnels, customer journey maps, and organizational improvement processes that involve repetitive structures.
-
Slide Structure
2-slide set. Each slide is divided into a turquoise or lime green header section and a white content area. The content area features a 3-node circular diagram (central dark gray, left dark gray, right turquoise) connected by bidirectional arrows, with text input areas below each node for customization.
Related Products
-

5P Marketing Mix Circular Diagram - Visualizing Business Strategies
#Business Vision and Strategy #Marketing Plan and Strategy #Diagram
-

Rainbow Arrow Diagram Template – Integrating Business Strategy
#Business Vision and Strategy #Business Management #Diagram
-

Visualizing Business Strategy with Four Color Arrow Diagram
#Product/Service Introduction #Business Vision and Strategy #Diagram
-

4P Strategy Cycle Diagram – Key to Marketing Success
#Business Vision and Strategy #Marketing Plan and Strategy #Diagram
