Visualizing Market Trends with Soft Line Graph
RJ0700001_10
- Last Update 07/21/2025
- File Size 0.6MB
- # of Slides 2
- File Format PPTX
- Slide Ratio 16:9
- Color
Keywords
- #Content-Based Slides
- #Design-Based Slides
- #Market and Competitor Analysis
- #Graph
- #Competitor Analysis
- #Market Analysis
- #Line
- #Line Chart
- #16:9
- #line chart PowerPoint slide
- #market analysis presentation
- #trend comparison chart
- #multi-series line graph
- #competitive analysis PPT
- #how to create line chart in PowerPoint
About the Product
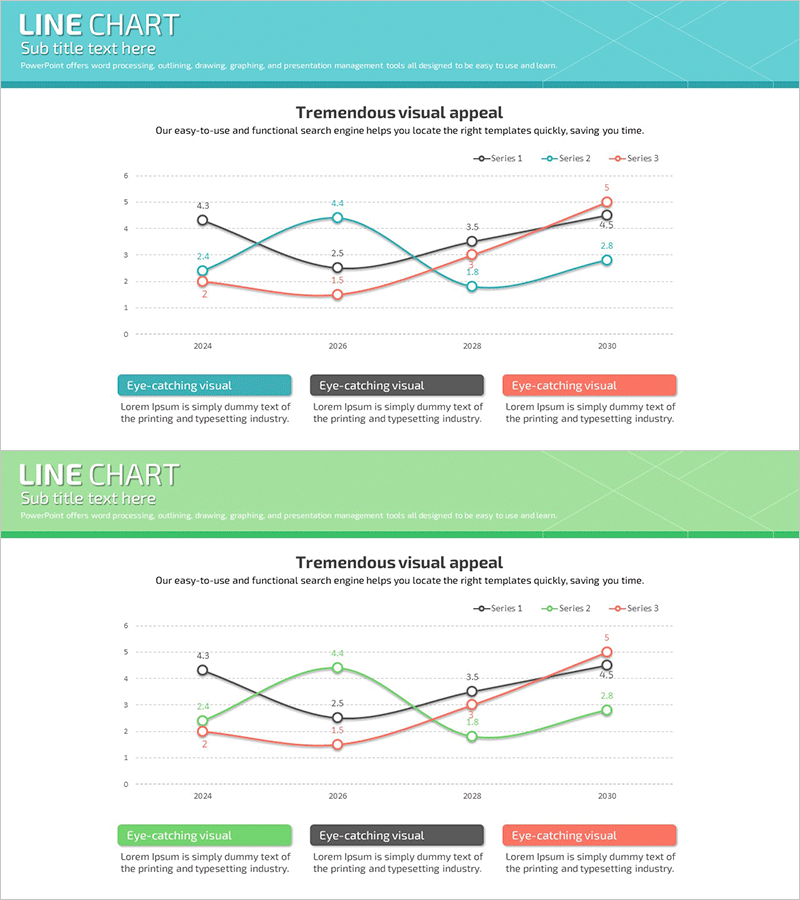
A multi-series line chart PowerPoint slide that compares three data sets across time periods from 2024 to 2030. The teal, black, and coral-colored lines clearly visualize market dynamics, competitive performance, and trend trajectories with precise data point labels. This presentation template is ideal for business reports, market analysis sections, competitive benchmarking, and quarterly performance reviews. The soft curve design ensures professional visual appeal while maintaining data clarity. Optimized for 16:9 widescreen format and provided in PPTX for easy editing and customization.
Usage Points
-
Main Usage
Visualize and compare multiple data series over time to identify market trends, performance patterns, and competitive positioning. This line chart excels at showing trajectory changes, growth rates, and comparative performance across different metrics or competitors simultaneously.
-
How to Use
Insert into business reports, investor presentations, quarterly earnings reviews, or market analysis decks. Replace sample data with your own figures, adjust line colors to match your brand, and customize the legend text to reflect your specific data categories. The chart is fully editable within PowerPoint.
-
Recommended For
Business executives, marketing managers, sales leaders, financial analysts, management consultants, and data-driven professionals. Particularly suited for quarterly performance presentations, market competitive analysis, customer trend analysis, and strategic planning sessions.
-
Slide Structure
Two-slide set featuring identical 3-series line charts. Each slide displays four time points (2024, 2026, 2028, 2030) on the X-axis with a 0–6 numerical scale on the Y-axis. Data points are marked with circles and labeled with exact values. A three-section text box area at the bottom provides space for series descriptions and insights.
Related Products
-

Data Analysis Graph Visualization for Market Competition
#Market and Competitor Analysis #Diagram #Graph
-

Black Navy Broken Line Graph Table – Market and Competitor Analysis
#Market and Competitor Analysis #Diagram #Graph
-

Medical Experimental Research Data Analysis Slide – Market and Competitor Analysis
#Market and Competitor Analysis #Graph #Competitor Analysis
-

Competitor Technology Comparison Graph – Market and Competitor Analysis
#Market and Competitor Analysis #Graph #Competitor Analysis
