Market Analysis Bar Chart – Hub of Data Visualization
RJ0700001_15
- Last Update 07/21/2025
- File Size 0.6MB
- # of Slides 2
- File Format PPTX
- Slide Ratio 16:9
- Color
Keywords
About the Product
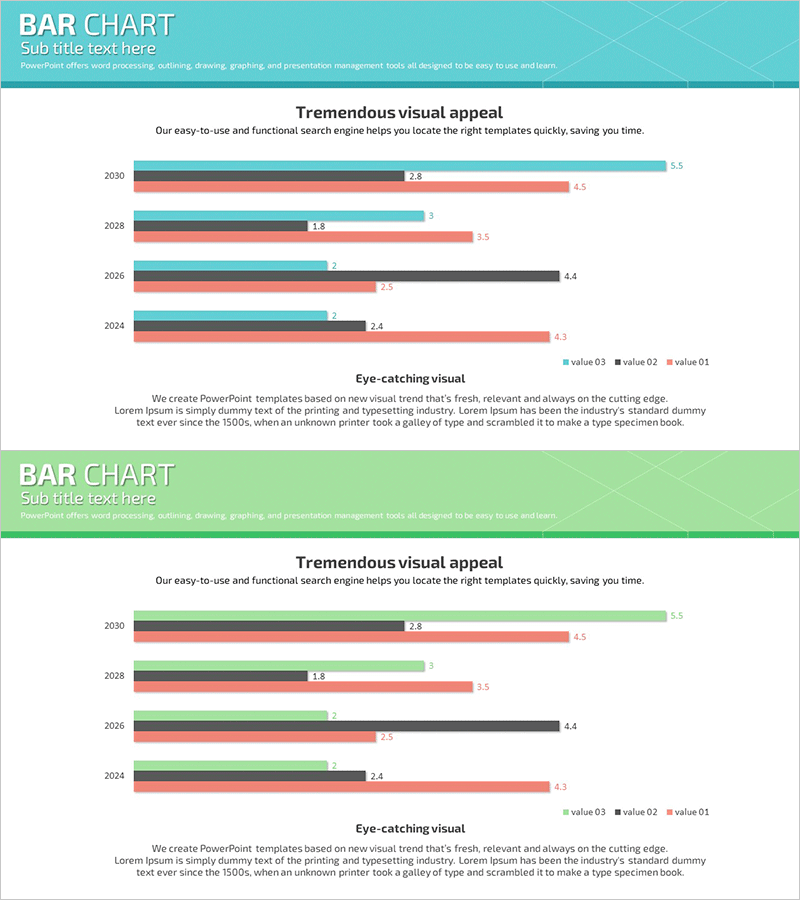
A grouped horizontal bar chart PowerPoint slide optimized for market analysis and competitive benchmarking. This presentation template displays data across four series from 2024 to 2030, arranged side-by-side to reveal trends and performance gaps between categories at a glance. Color-coded in teal, gray, and coral to distinguish each series, with clear numerical labels for precise data reading. Ideal for marketing plans, business reports, investor presentations, and any data-driven decision-making scenario where multi-series comparison is essential.
Usage Points
-
Main Usage
Visualize multi-series data comparison across time periods using grouped horizontal bars. Perfect for displaying market size trends, competitor revenue benchmarks, product category sales evolution, and other scenarios where relative performance differences across multiple categories and years must be communicated simultaneously.
-
How to Use
Insert this slide into the market analysis section of marketing plans, performance review pages of business reports, or competitive landscape slides in investor pitches. Simply replace existing data with your figures; bar lengths adjust automatically, making it ready for immediate presentation use.
-
Recommended For
Marketing managers, business strategists, financial analysts, and executives presenting market dynamics and competitive positioning. Recommended for any business presentation requiring quarterly or annual performance comparisons across multiple data series.
-
Slide Structure
Two-slide layout. First slide features a teal header background with title area. Second slide displays a grouped horizontal bar chart with four color-coded series (teal, gray, coral, charcoal) representing 2024–2030 data. Numerical labels appear at the end of each bar for accurate value comparison.
Related Products
-

Market Analysis Graph by Year – Visualizing Competitive Advantage
#Market and Competitor Analysis #Graph #Market Analysis
-

Market Analysis Bar Graph – Effective Data Visualization
#Market and Competitor Analysis #Graph #Market Analysis
-

Management Performance Analysis Bundle Chart
#Business Strategy #Market and Competitor Analysis #Graph
-

Horizontal Bar Chart for Financial Business Market Analysis
#Market and Competitor Analysis #Graph #Competitor Analysis
