Office PowerPoint Templates Wide – Business Focused Presentation Design
J0300075
- Last Update 01/07/2025
- File Size 25.4MB
- # of Slides 30
- File Format PPTX
- Slide Ratio 16:9
- Color
Slide Preview


Keywords
About the Product
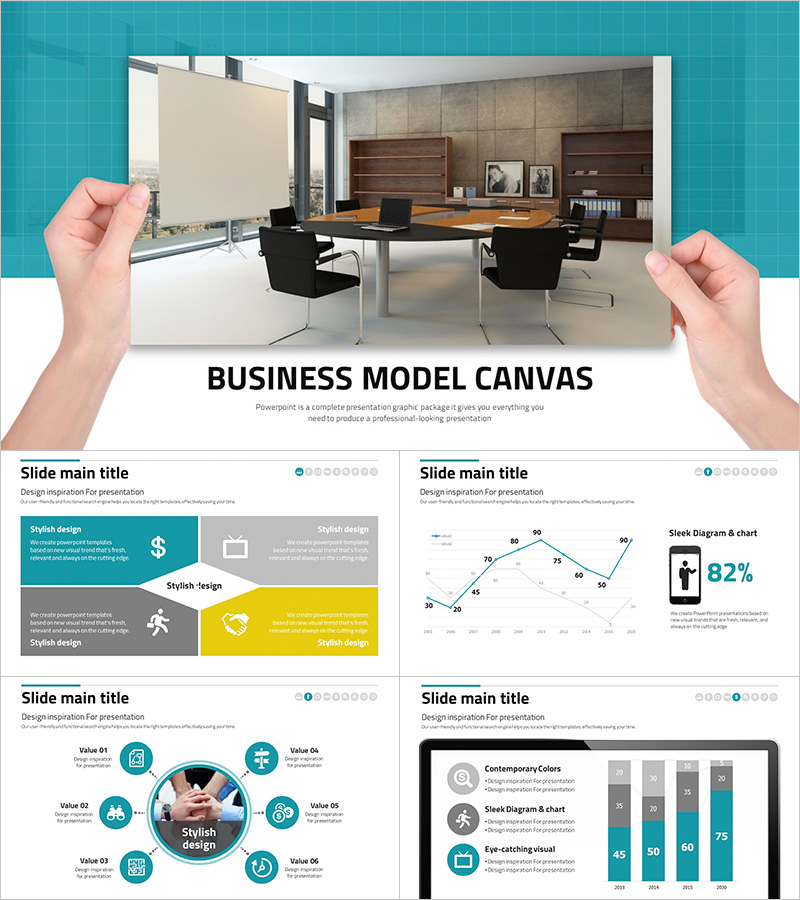
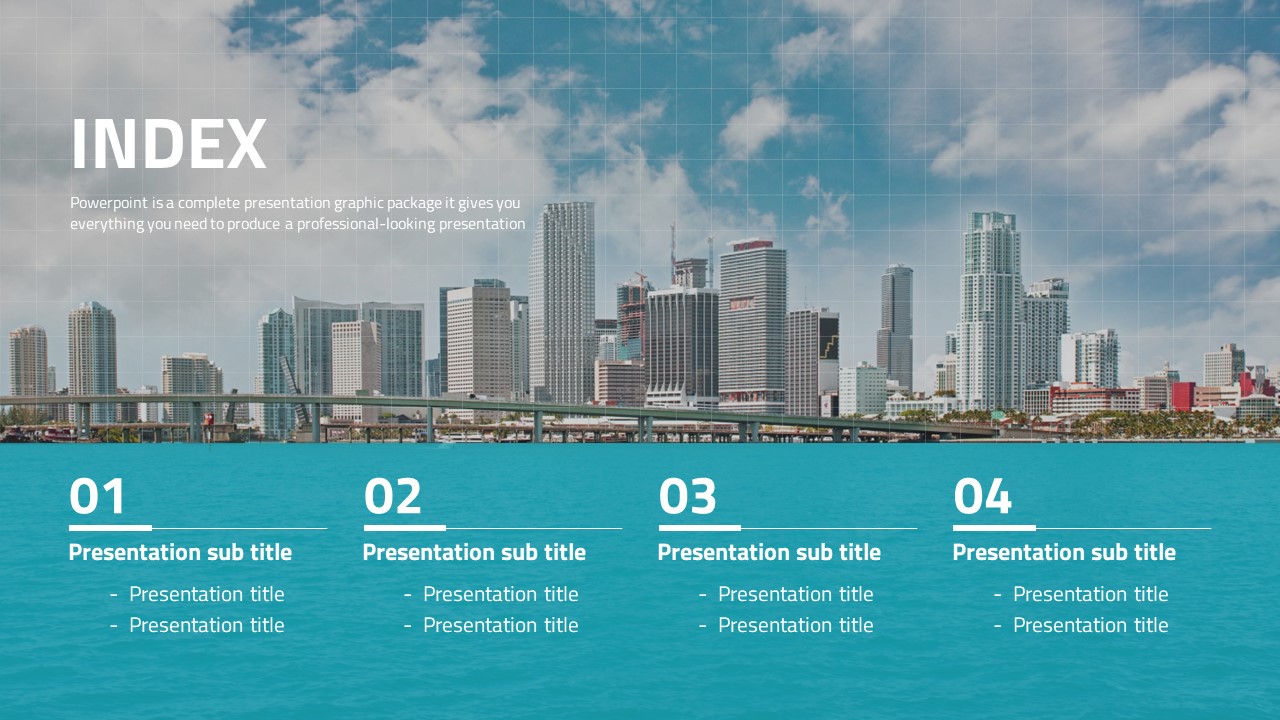
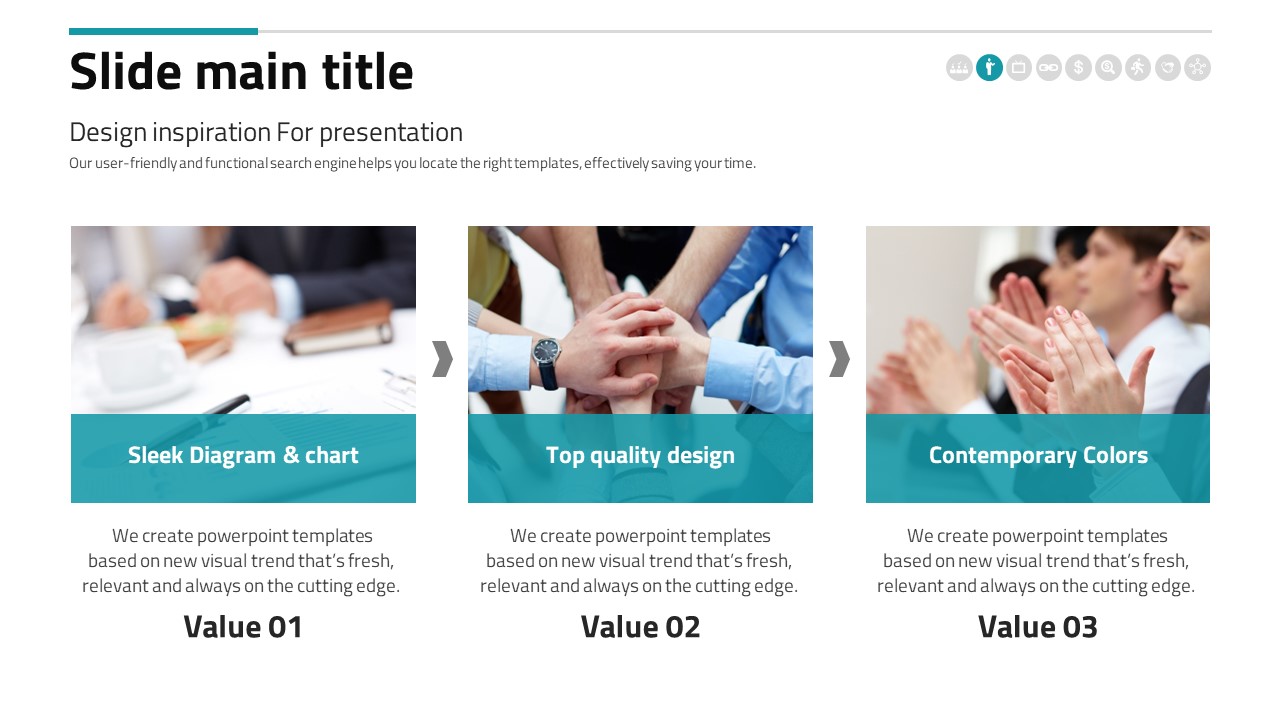
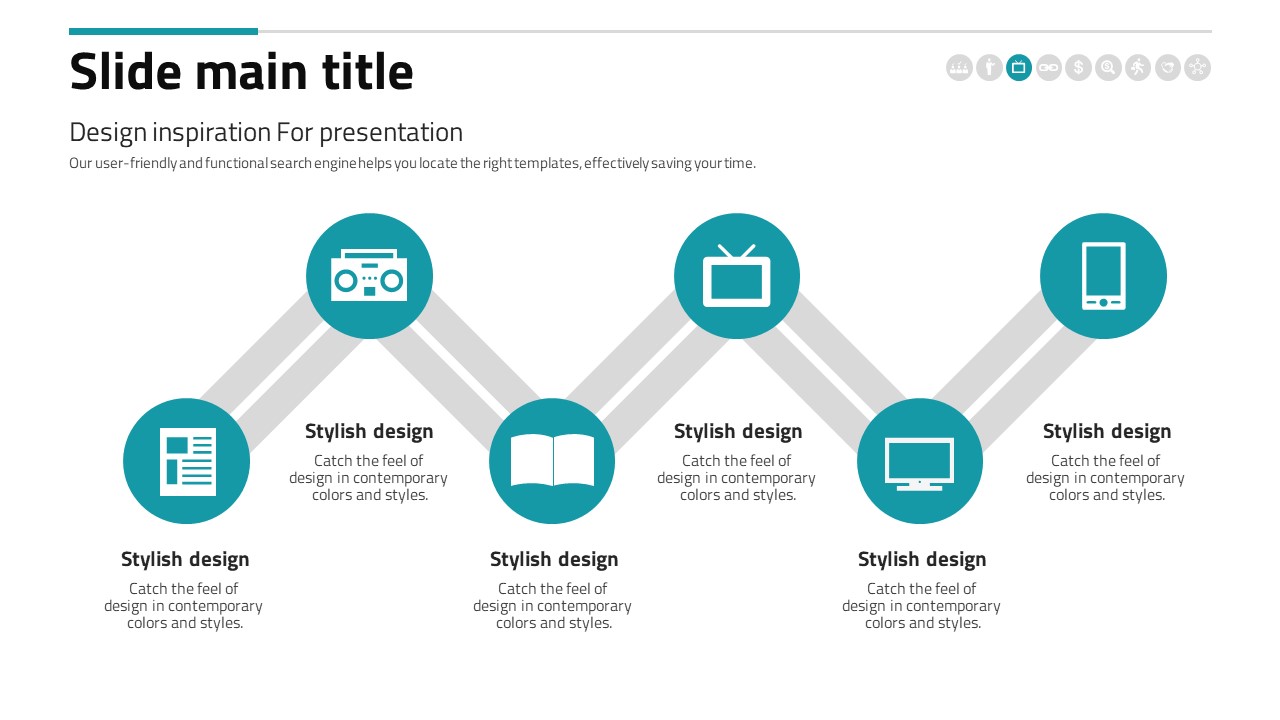
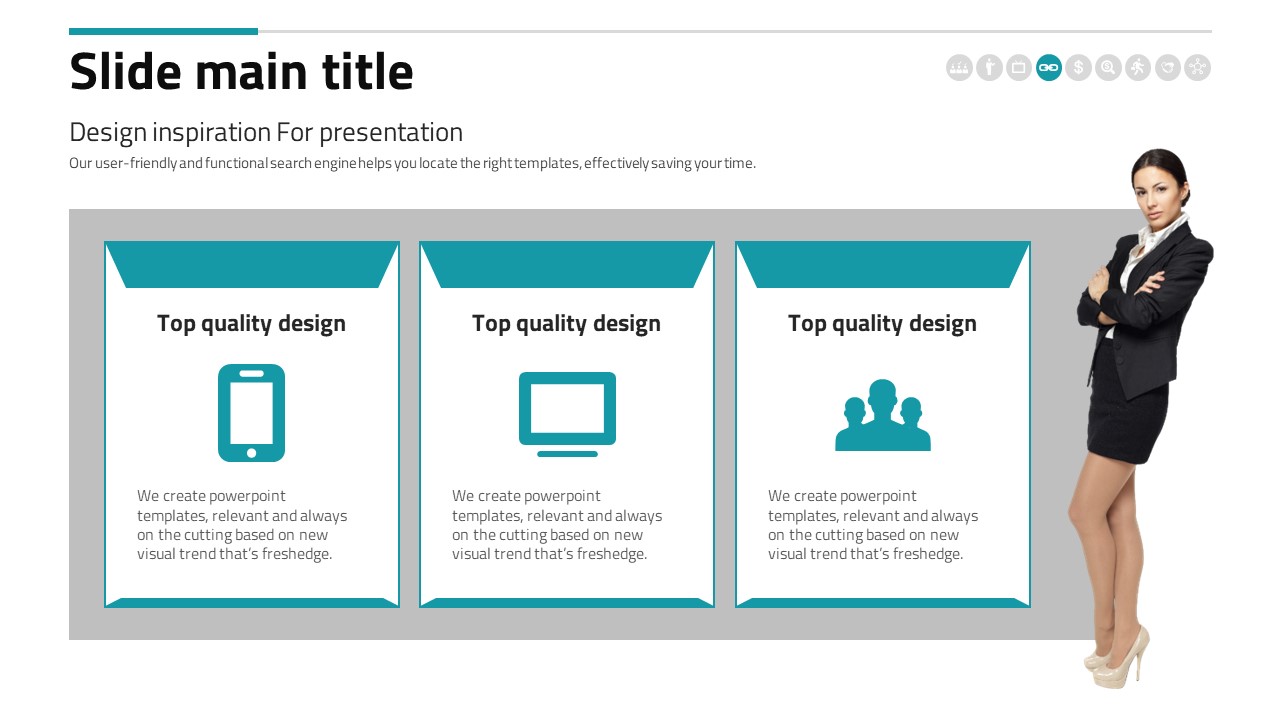
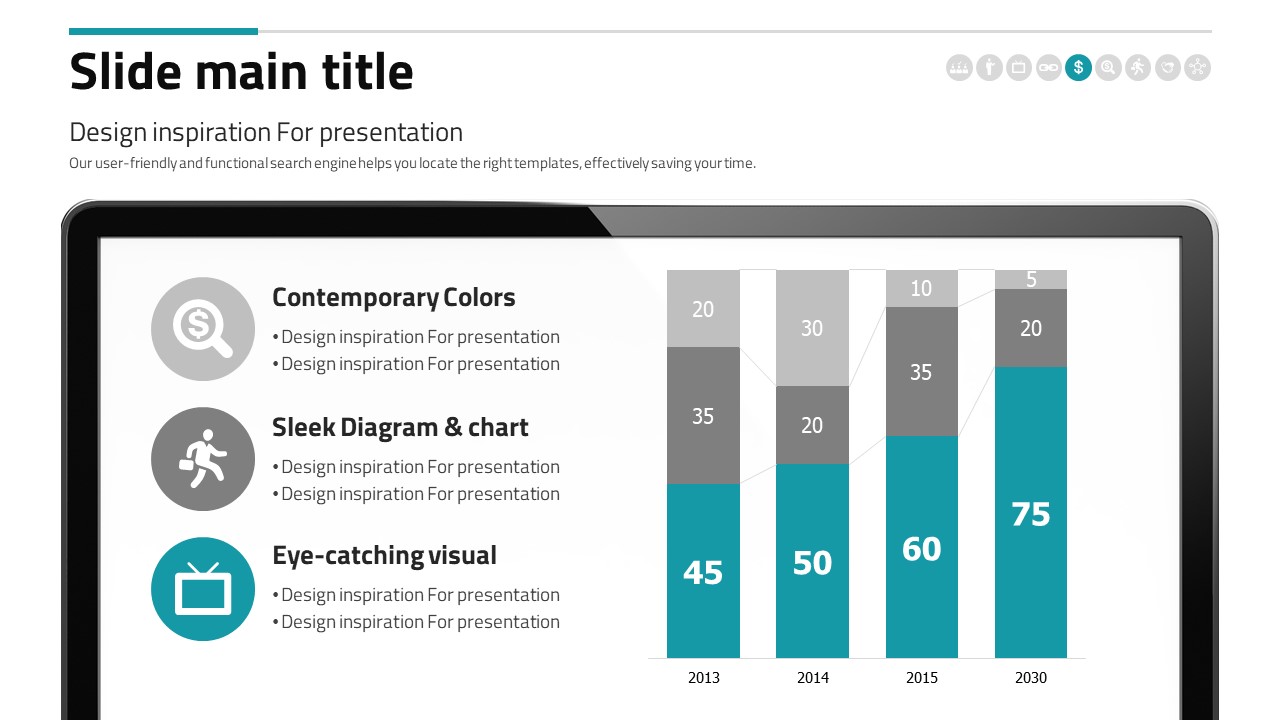
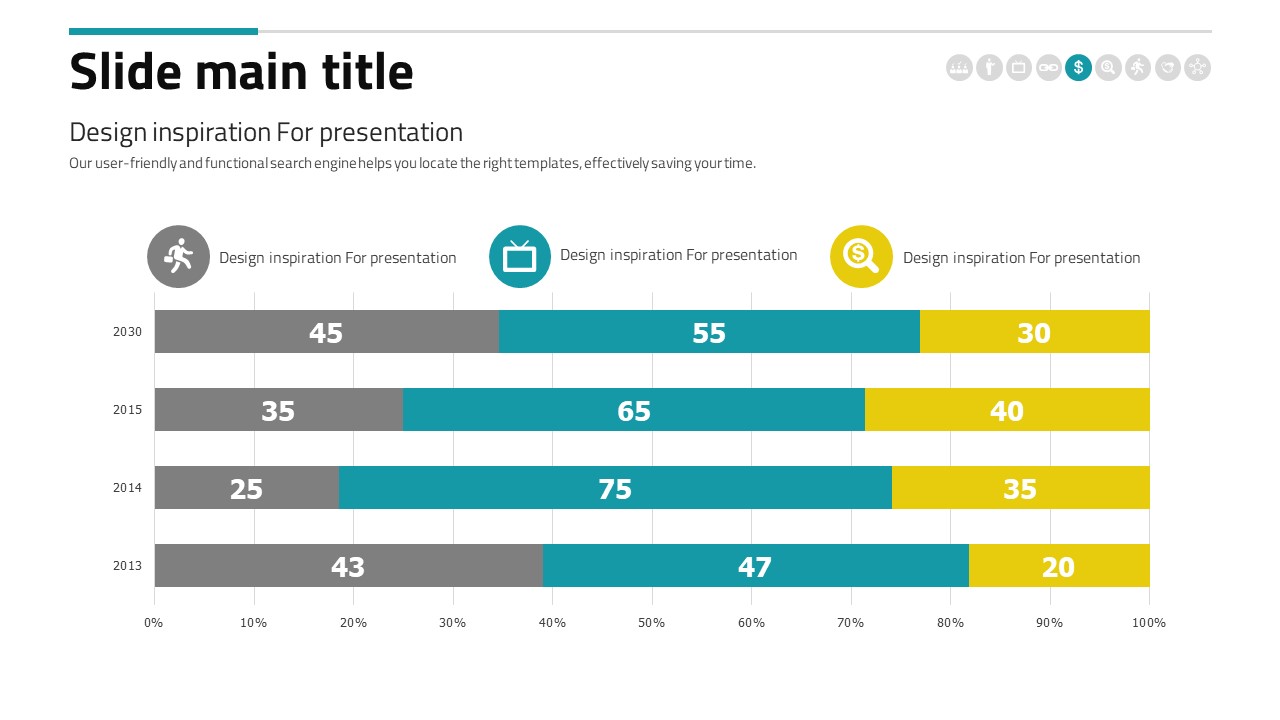
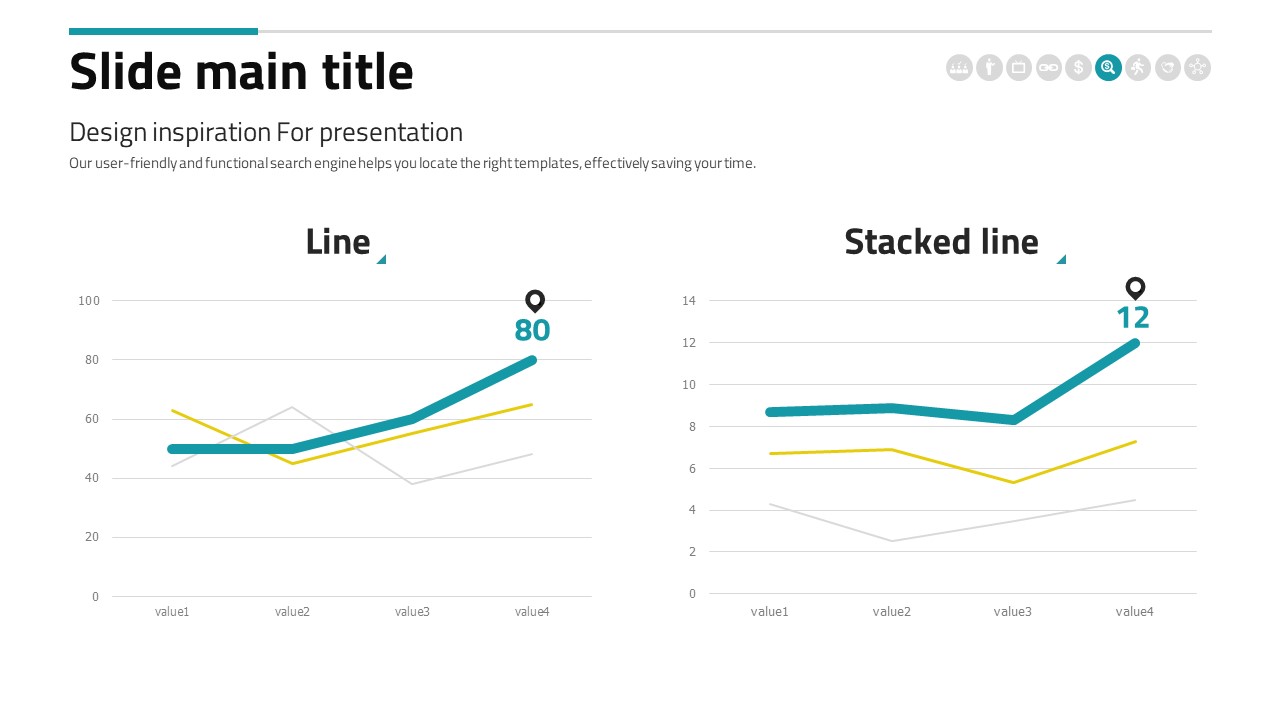
This professional business PowerPoint template features a teal accent color applied consistently across all slides, paired with a clean white background and minimal grid layout. The cover slide uses a real office meeting room photo to establish a credible, corporate atmosphere from the first impression. Inside, you'll find a wide variety of data visualization slides including a world map with donut chart, year-over-year line chart, six-item circular icon diagram, and two-column comparison layouts — making it easy to present strategies, market data, and business models with clarity. With 30 slides in total, this presentation template covers everything from the title slide through body content to closing, providing a complete deck structure ready for immediate use. The PPTX format allows full editing of text, colors, and images in PowerPoint or any compatible program, so you can adapt each slide to your specific business context without starting from scratch.
Usage Points
-
Main Usage
Designed for corporate strategy presentations, business model explanations, investor meetings, and partner pitches. The teal accent color and clean white layout help convey professionalism and credibility to any business audience.
-
How to Use
Download the PPTX file and open it in PowerPoint or a compatible application. Replace the placeholder text, data values, and images with your own content. Line charts and donut charts are fully editable so you can input real figures directly into each slide.
-
Recommended For
Ideal for corporate strategy teams, marketing managers, sales professionals, startup founders, and business consultants who regularly create presentation materials. Also well-suited for anyone presenting global market data or business model frameworks.
-
Slide Structure
30 slides total: office photo cover slide, world map with 75% donut chart, year-over-year line chart with percentage callout, six-item circular icon diagram, two-column comparison layout, and additional body and closing slides covering the full presentation flow.
Related Products
-

Multitasking Presentation Template – Optimized Design for Business
#Business
-

Partnership PowerPoint Template – Ideal for Business Presentations
#Business
-

Business Work Item Presentation Template – Professional Design
#Business
-

Fountain Pen Theme Presentation – Elegant Business Slide Design
#Business
