Competitor Comparison Analysis Graph – Enhancing Market Competitiveness
RJ0300075_11
- Last Update 05/09/2025
- File Size 1MB
- # of Slides 2
- File Format PPTX
- Slide Ratio 16:9
- Color
Keywords
About the Product
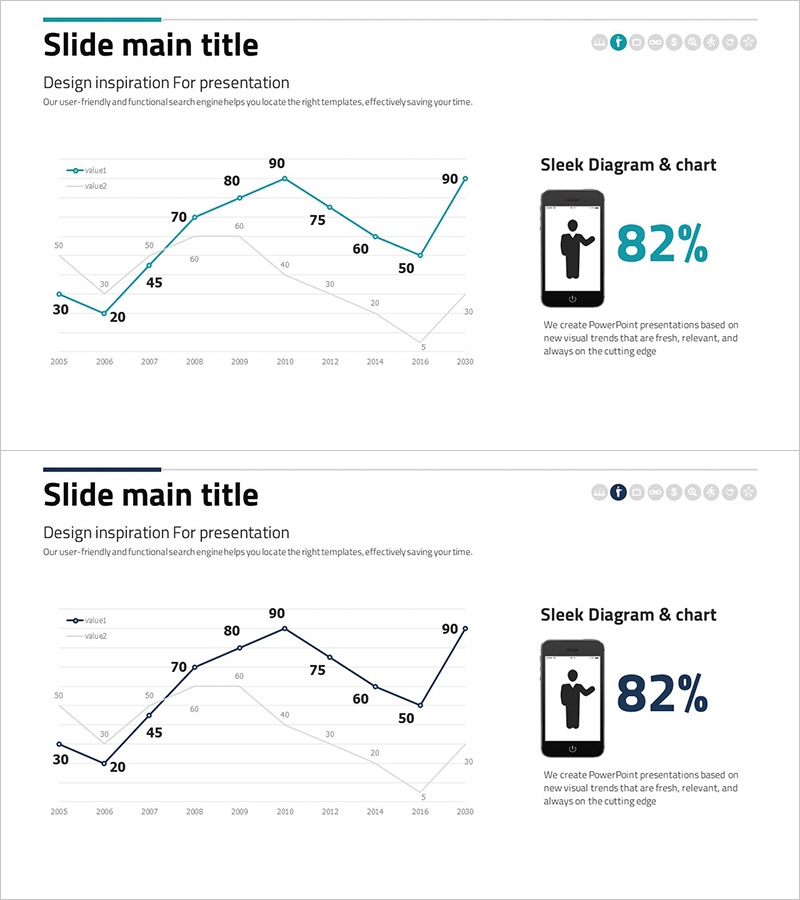
A dual-series line chart PowerPoint slide designed for competitor analysis and market trend visualization. This presentation template displays two data series across multiple years, enabling clear comparison of competitive positioning and market dynamics. The teal-colored lines and data point markers create a professional visualization suitable for business strategy presentations, competitive benchmarking reports, and market analysis documents. Fully editable PPTX format allows instant customization for quarterly or annual performance comparisons.
Usage Points
-
Main Usage
Visualize competitive performance metrics and company performance across years to establish market positioning. The dual trend lines reveal temporal patterns and growth trajectories, enabling data-driven strategic decision-making and competitive advantage analysis.
-
How to Use
Integrate into executive presentations, investor pitch decks, business strategy meetings, and market analysis seminars. The chart automatically updates when data values are modified, making it suitable for quarterly earnings reports, annual performance reviews, and ongoing competitive intelligence briefings.
-
Recommended For
Marketing managers, business strategists, C-suite executives, management consultants, and investment analysts presenting competitive landscape analysis. Particularly effective for B2B companies preparing business plans, quarterly performance reports, and investor relations materials.
-
Slide Structure
Comprises two data series (value1, value2) represented as continuous lines with 16 data points spanning 2005–2020. Layout includes left-side legend, central chart area, and right-side key metric highlight (82%) for immediate visual impact and comparative insight.
Related Products
-

Medical Development Data Analysis Graph – Market and Competitor Analysis
#Market and Competitor Analysis #Graph #Competitor Analysis
-

Data Analysis Graph Visualization for Market Competition
#Market and Competitor Analysis #Diagram #Graph
-

Gradient Line Graph – Market and Competitor Analysis
#Market and Competitor Analysis #Graph #Competitor Analysis
-

Project Market Environment Analysis Chart – Powerful Competitive Strategy
#Market and Competitor Analysis #Graph #Competitor Analysis
