Competitor Analysis Bilinear Bar Graph – Visualizing Market Advantage
RJ0300075_15
- Last Update 05/09/2025
- File Size 1MB
- # of Slides 2
- File Format PPTX
- Slide Ratio 16:9
- Color
Keywords
- #Content-Based Slides
- #Design-Based Slides
- #Market and Competitor Analysis
- #Graph
- #Competitor Analysis
- #Competitive Advantage
- #Horizontal Bar
- #Double Horizontal Bar
- #16:9
- #bilinear bar chart PowerPoint
- #competitor analysis slide
- #horizontal bar graph template
- #market comparison chart
- #business strategy presentation
About the Product
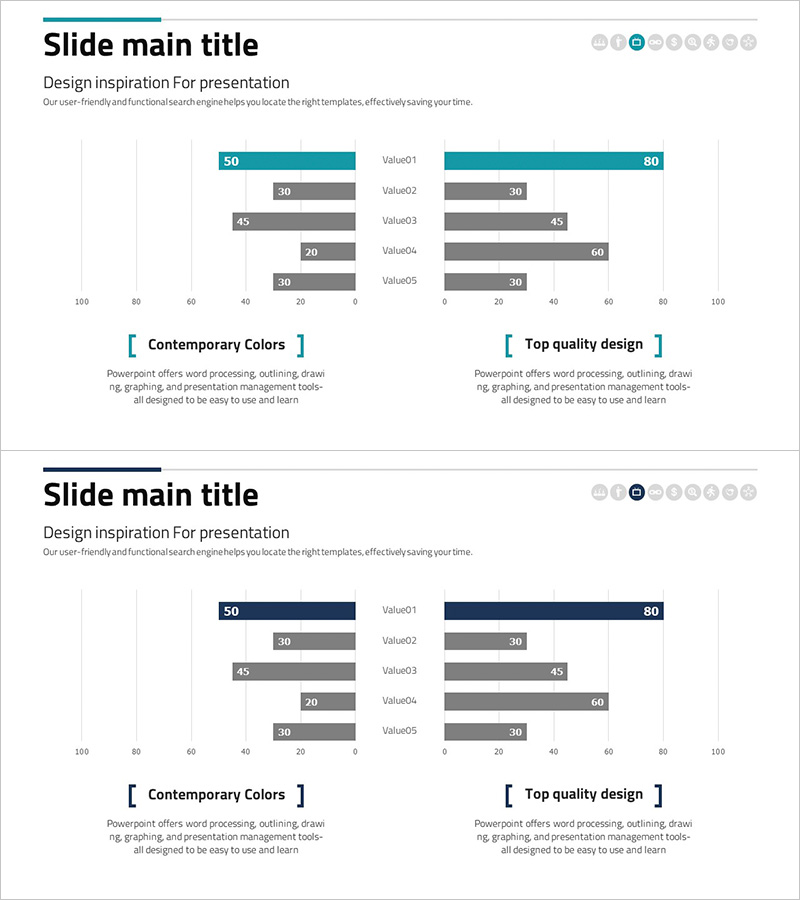
A bilinear horizontal bar chart PowerPoint slide that visualizes competitive positioning and market advantage at a glance. This presentation template displays five data items symmetrically on both sides of a center axis, enabling direct comparison between competitors. The teal and gray color scheme clearly differentiates the two data series, with numerical labels displayed above each bar for precise value comparison. Ideal for business strategy presentations, market analysis reports, investor pitch decks, and competitive positioning discussions.
Usage Points
-
Main Usage
Compare competitor performance, capabilities, and market share using a symmetrical left-right structure to clearly demonstrate relative advantage. Effectively communicate competitive positioning to investors, employees, and clients with persuasive visual data representation.
-
How to Use
Insert this slide in the competitive analysis section of business strategy presentations or position it in market analysis reports. Edit the bar values with actual data for immediate use, and customize colors and item labels to match your organization's branding guidelines.
-
Recommended For
Marketing professionals, strategy planners, sales executives, and investor relations teams presenting competitive advantages. Highly applicable in startup pitch decks, corporate strategy presentations, new business proposals, and market analysis reports.
-
Slide Structure
Two-slide set with distinct color schemes: the first slide features teal accent coloring, while the second uses dark blue accents. Each slide displays five data items (Value01–Value05) with bilinear bars arranged symmetrically around a center baseline, with numerical labels positioned above each bar segment.
Related Products
-

Comparative Analysis of Sales of Camping Competitors – Insights and Comparisons
#Market and Competitor Analysis #Graph #Competitor Analysis
-

Competitor Analysis Double Bar Graph – Visualizing Competitive Advantage
#Market and Competitor Analysis #Graph #Competitor Analysis
-

Competitor Analysis Thin Bar Graph – Visualizing Market Competitive Advantage
#Market and Competitor Analysis #Graph #Competitor Analysis
-

Gender Ratio Bar Graph – Market and Competitor Analysis
#Market and Competitor Analysis #Graph #Competitor Analysis
