Analysis Graph by Age Group in Europe – Data-Driven Strategy
RJ0300075_19
- Last Update 05/09/2025
- File Size 4.2MB
- # of Slides 2
- File Format PPTX
- Slide Ratio 16:9
- Color
Keywords
- #Content-Based Slides
- #Design-Based Slides
- #Product/Service Introduction
- #Marketing Plan and Strategy
- #Graph
- #Other
- #Development Status
- #Target Market Strategy
- #16:9
- #Europe age group analysis PowerPoint
- #demographic data visualization slide
- #pie chart market analysis
- #regional population PPT
- #how to create demographic charts in PowerPoint
About the Product
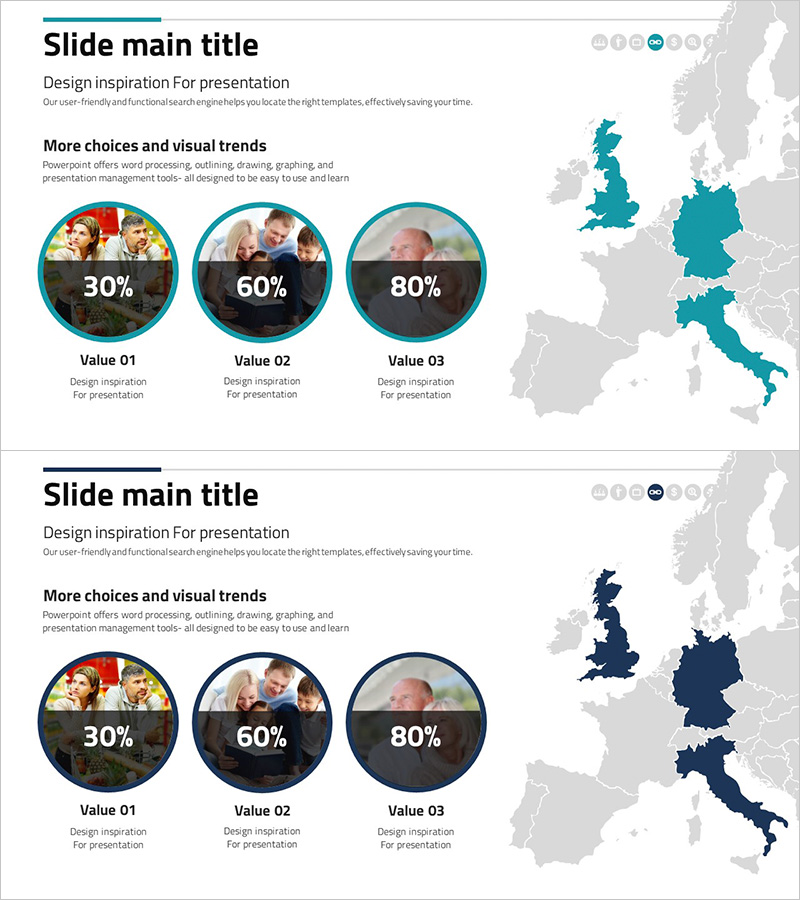
A PowerPoint slide visualizing Europe's age distribution across regions using pie charts and geographic mapping. The slide displays three comparative data points (30%, 60%, 80%) in circular chart format alongside a color-coded European map, enabling quick market segment analysis. Ideal for marketing strategy presentations, competitive analysis, and demographic research. The 2-slide set integrates seamlessly into market analysis sections of business proposals, pitch decks, and investor presentations.
Usage Points
-
Main Usage
Visualize European market demographics by age cohort to support data-driven marketing and business strategy decisions. Provides actionable insights for identifying target customer segments and regional market characteristics across Europe.
-
How to Use
Insert into the market analysis or competitive landscape section of your presentation. Replace the sample percentages with your actual demographic data and adjust map colors to match your brand palette. Fully editable text fields and chart values allow quick customization.
-
Recommended For
Marketing strategists, business development managers, management consultants, and executives presenting European market expansion plans. Suitable for marketing proposals, business plans, investor pitch decks, and market research presentations targeting European audiences.
-
Slide Structure
Slide 1 features a title area, descriptive text, three pie charts with percentage labels (30%, 60%, 80%), and editable value fields below each chart. Slide 2 presents a color-coded European map on the left with three pie charts positioned on the right for side-by-side regional comparison.
Related Products
-

Target Market Analysis Bar Graph – Visualizing Market Strategies
#Market and Competitor Analysis #Marketing Plan and Strategy #Graph
-

Target Market Entry Analysis Graph
#Company Introduction #Marketing Plan and Strategy #Graph
-

Business Development Status Diagram – Market Share and Competitive Analysis
#Product/Service Introduction #Market and Competitor Analysis #Diagram
-

Graph of the Status of European Target Region Analysis – Market Trends Visualization
#Market and Competitor Analysis #Marketing Plan and Strategy #Graph
