Business Overlapping Circular Diagram – Cluster and Business Introduction
RJ0300075_24
- Last Update 05/09/2025
- File Size 0.8MB
- # of Slides 2
- File Format PPTX
- Slide Ratio 16:9
- Color
Keywords
- #Content-Based Slides
- #Design-Based Slides
- #Company Introduction
- #Business Introduction
- #Diagram
- #Business Areas
- #Business Areas
- #Cluster
- #Combination Diagram
- #16:9
- #overlapping circular diagram PowerPoint
- #cluster diagram slide template
- #4-circle intersection slide
- #business domain diagram
- #business introduction PowerPoint slide
About the Product
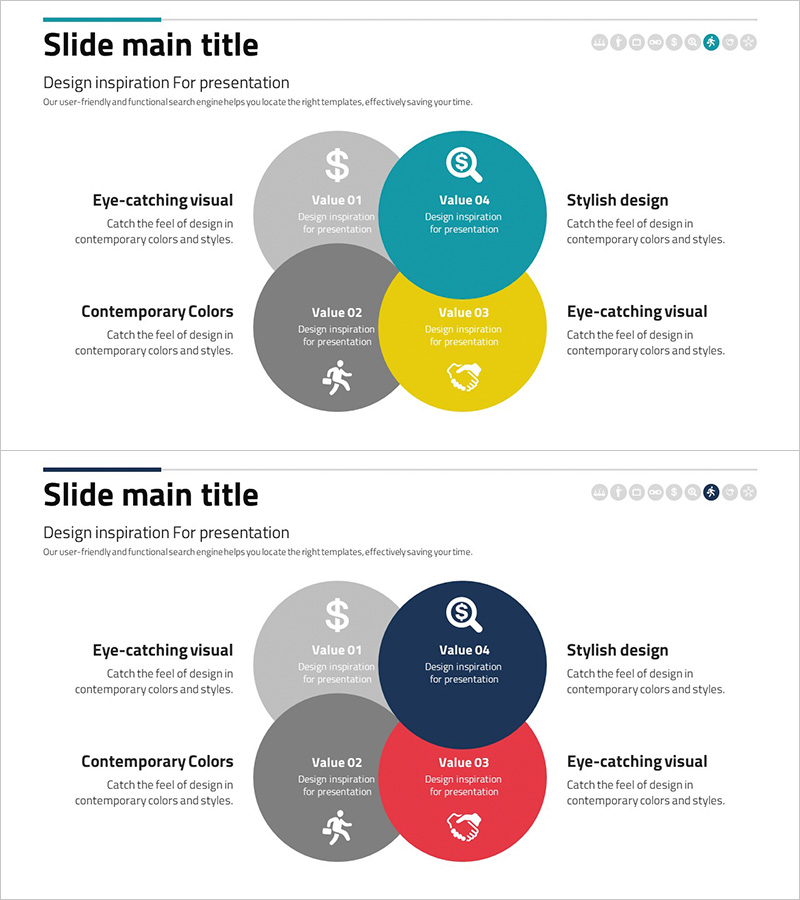
A cluster diagram PowerPoint slide featuring four circular nodes overlapping to visualize intersection relationships and shared domains. The multi-color design with gray, yellow, and teal accents demonstrates both independence and connectivity across business areas. This presentation slide effectively illustrates business value, design inspiration, visual emphasis, and functional integration—ideal for explaining business domains, strategic intersections, and organizational role overlaps. The 2-slide set includes two color variations (teal-yellow and navy-red) for flexible use across different presentation contexts and corporate environments.
Usage Points
-
Main Usage
Optimized for visualizing intersections and relationships among four key elements. Use this slide to emphasize strategic convergence points, highlight overlapping organizational roles, or illustrate shared business domains. Ideal for business strategy presentations, value proposition explanations, and domain introduction discussions.
-
How to Use
Enter text and icons into each circular node to define the four domains. Place your core message in the central intersection area to emphasize strategic convergence. Select the color variation that best matches your presentation tone—choose between teal-yellow or navy-red combinations.
-
Recommended For
Recommended for executives, strategy teams, marketing departments, and business development teams. Particularly suited for new business planning, organizational role definition, value proposition presentations, and investor pitches that require strategic intersection analysis.
-
Slide Structure
Four circular nodes intersect at the center in a Venn diagram structure. Each circle contains icons, text labels, and descriptive content, with the central intersection area highlighting the core message. The 2-slide set provides two color variations: teal-yellow and navy-red combinations for different presentation contexts.
Related Products
-

Overlapping Diagram Visualizing Renewable Energy Service Configuration
#Company Introduction #Business Introduction #Diagram
-

Entertainment Business Area Diagram – Dynamics of Business
#Company Introduction #Business Introduction #Diagram
-

Business Area Overlay Diagram – A Blend of Visual Appeal and Functionality
#Company Introduction #Business Introduction #Diagram
-

Medical Pictogram Overlay Diagram
#Company Introduction #Business Introduction #Diagram
