Graph Analyzing the Status of U.S. Residents – Understanding Markets and Customers
RJ0300075_26
- Last Update 05/09/2025
- File Size 0.9MB
- # of Slides 2
- File Format PPTX
- Slide Ratio 16:9
- Color
Keywords
About the Product
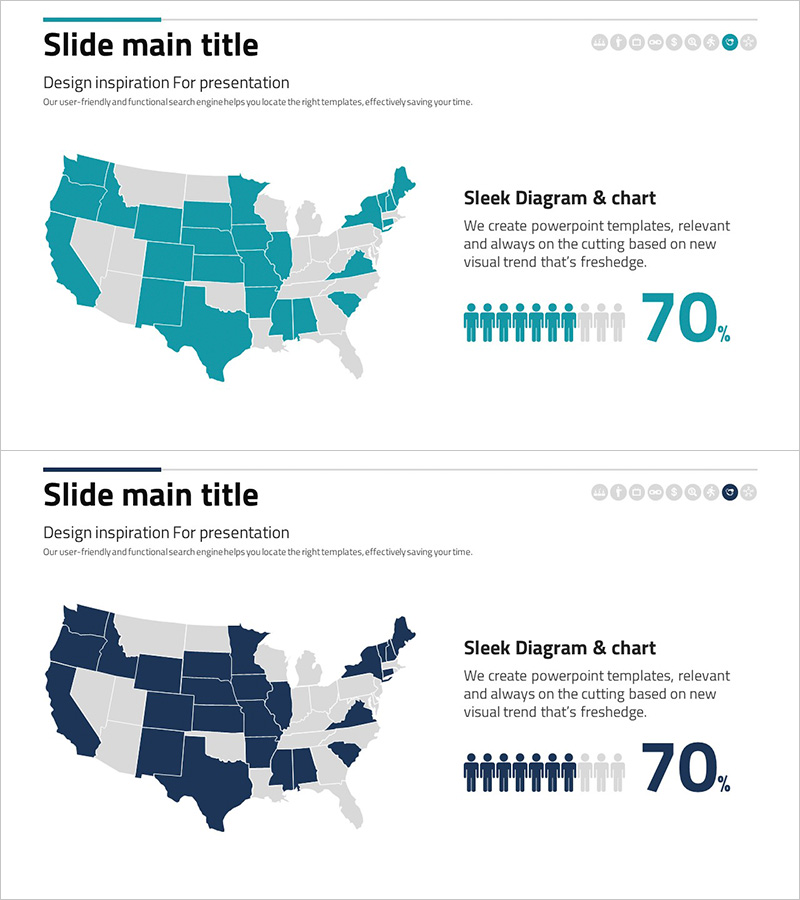
A PowerPoint slide visualizing U.S. resident distribution across states with a color-coded map. The two-tone design uses teal and gray to highlight regional population density, while the right side displays demographic percentages with icons and numerical data. Ideal for market analysis, customer segmentation, and regional marketing strategy presentations. The 2-slide set includes color variations (teal and navy) with fully editable text and data fields for customization.
Usage Points
-
Main Usage
Presents U.S. regional resident distribution to support market targeting and customer analysis. The map-based visualization makes complex geographic data intuitive and actionable, helping investors, partners, and executives make informed decisions about market expansion and customer focus.
-
How to Use
Use in the market analysis section to explain regional customer distribution or as a supporting visual in marketing strategy presentations. Customize map colors or highlight specific states to emphasize business priorities and geographic focus areas.
-
Recommended For
Marketing plans, business proposals, investor pitch decks, market research reports, and regional expansion strategies. Particularly suited for U.S. market entry, regional sales strategy, and customer segmentation presentations in B2B and B2C contexts.
-
Slide Structure
Two-column layout with a state-coded U.S. map on the left and text/statistics area on the right. The map accommodates title and descriptive text overlays, while the right section displays demographic icons (7-person representation) and percentage figures (70%) to emphasize comparative analysis data.
Related Products
-

Data Visualization Slide Template Featuring World Map
#Market and Competitor Analysis #Graph #Other
-

Customer Analysis by Country Slide – Market Trends and Insights
#Market and Competitor Analysis #Graph #Other
-

Global Customer Market Analysis Slide – Market and Competitor Analysis
#Market and Competitor Analysis #Graph #Other
-

Analysis of User Gender Ratio by Target Country – Providing Market Insights
#Market and Competitor Analysis #Graph #Other
