Business Process Connection Diagram – Strategic Network Visualization
RJ0300075_14
- Last Update 05/09/2025
- File Size 0.8MB
- # of Slides 2
- File Format PPTX
- Slide Ratio 16:9
- Color
Keywords
- #Content-Based Slides
- #Design-Based Slides
- #Business Vision and Strategy
- #Operational Plan
- #Diagram
- #Business Strategy
- #Business Processes
- #Cluster
- #Chain Diagram
- #16:9
- #radial diagram PowerPoint
- #business network presentation
- #connection diagram slide
- #organizational structure PPT
- #process flow PowerPoint
- #strategic visualization slide
About the Product
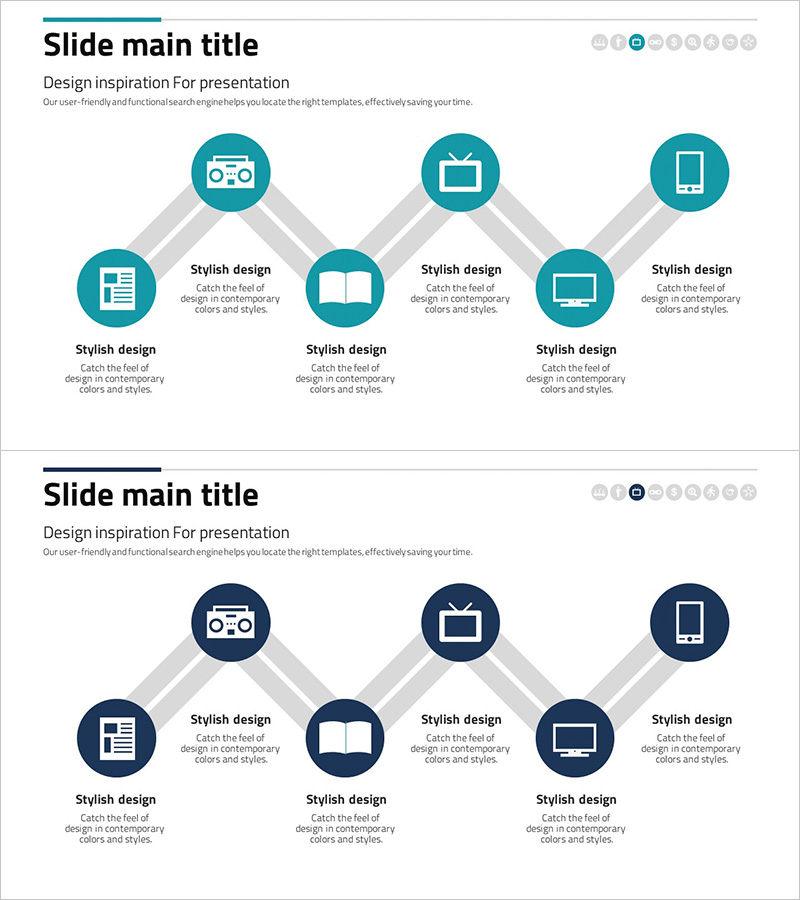
A radial connection diagram PowerPoint slide that expands from a central core to six key business elements. This presentation template is optimized for visualizing business processes, organizational structures, and strategic network relationships. Gray connecting lines clearly express interactions between each node, while icons and text areas enable detailed explanation of each element's role. Available in two color versions (teal and navy blue) to match your corporate brand identity. Provided in 16:9 widescreen PPTX format for immediate use in any presentation environment.
Usage Points
-
Main Usage
Designed to display at a glance how six major business areas, departments, or processes branch from an organization's core strategy. Ideal for executive reports, business strategy presentations, organizational restructuring explanations, and marketing channel structure illustrations.
-
How to Use
Enter your core concept (company name, strategy, or objective) in the central circular node, then place detailed items (departments, functions, channels, strategic initiatives) in the six surrounding nodes. Customize by replacing node icons or editing text to match your organization's actual structure.
-
Recommended For
Executives, strategy teams, organizational development professionals, marketing teams, and project managers explaining organizational structures, business strategies, and interdepartmental collaboration. Highly effective in board meetings, executive briefings, team kickoff sessions, and strategic planning workshops.
-
Slide Structure
Two-slide set. Slide 1: Teal background with 6-node radial diagram (1 central node + 6 surrounding nodes with gray connecting lines). Slide 2: Navy blue background with identical diagram structure. Each node features separate icon and text input areas. 16:9 widescreen format.
Related Products
-

Connecting Dreams with Visualization Diagrams
#Product/Service Introduction #Business Vision and Strategy #Diagram
-

Construction Work Flow System – Efficient Operation Planning and Risk Management
#Operational Plan #Diagram #Business Processes
-

Visualizing Logistics Transportation System – Strategic Operational Management
#Business Strategy #Operational Plan #Diagram
-

Sports Implication Connection Diagram – Business Strategy Presentation
#Product/Service Introduction #Business Vision and Strategy #Diagram
