Business Service Analysis Segmentation Graph – Ideal for Market and Competitor Analysis
RJ0300075_21
- Last Update 05/09/2025
- File Size 0.8MB
- # of Slides 2
- File Format PPTX
- Slide Ratio 16:9
- Color
Keywords
- #Content-Based Slides
- #Design-Based Slides
- #Market and Competitor Analysis
- #Graph
- #Competitor Analysis
- #Market Analysis
- #Horizontal Bar
- #Segmented Horizontal Bar
- #16:9
- #segmentation bar chart PowerPoint
- #stacked bar chart slide
- #market analysis presentation
- #competitor analysis graph
- #data visualization PPT
- #business analysis chart template
About the Product
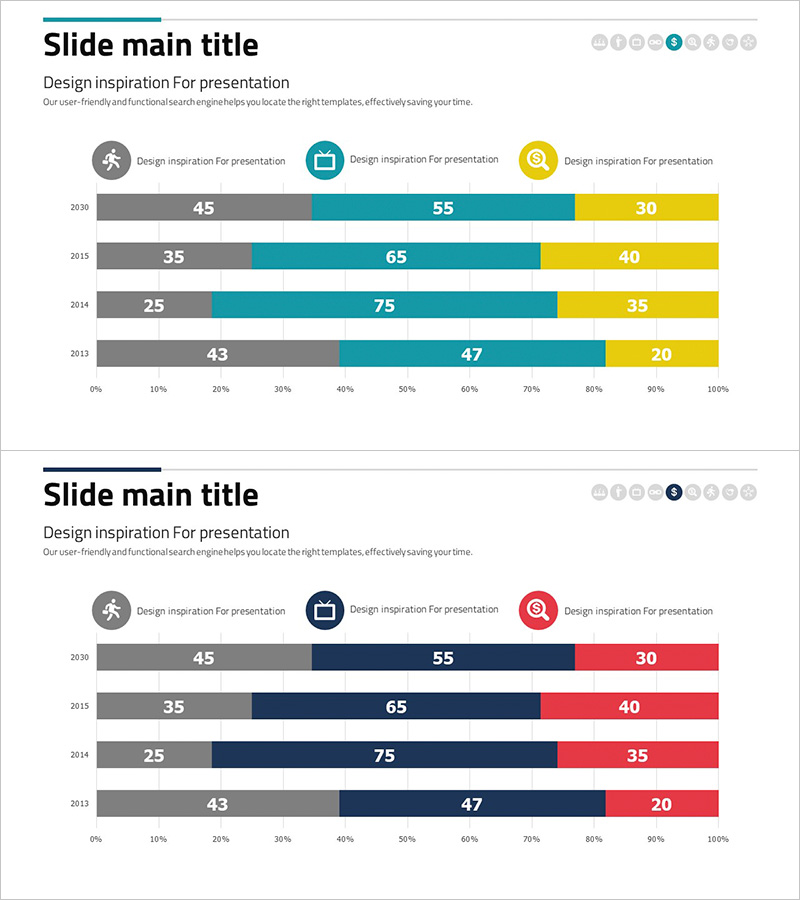
A segmentation bar chart PowerPoint slide designed for business and service analysis presentations. This slide features a horizontal stacked bar chart with three color-coded categories (gray, teal, and yellow) displaying data across four years from 2013 to 2020. Each year shows the proportional breakdown of three segments, making it ideal for visualizing market share, competitor analysis, and customer segmentation. The 2-slide PPTX template allows you to easily edit colors, values, and labels to match your presentation needs and corporate branding.
Usage Points
-
Main Usage
Effectively compare multi-category data such as market share, competitor positioning, and customer segments across multiple years. The stacked bar format simultaneously displays total volume and individual segment proportions, making it ideal for trend analysis and supporting strategic decision-making.
-
How to Use
Insert this slide into the market analysis section of business plans, marketing proposals, or quarterly performance reports. Edit the values, legend labels, and year indicators in the slide master, then customize the colors to match your corporate brand palette. Use during presentations to highlight growth rates and segment performance.
-
Recommended For
Strategy planners, marketing managers, sales directors, and executives presenting market analysis and competitive positioning. Particularly effective in B2B proposals, investor pitch decks, and business performance reviews where data credibility is essential.
-
Slide Structure
Two-slide template featuring horizontal stacked bar charts with four years of data (2013, 2014, 2015, 2020) segmented into three categories. Color-coded legend and icons clearly distinguish each segment, with a 0%-100% horizontal axis scale enabling easy proportion comparison.
Related Products
-

Horizontal Bar Graph Broken Down by Year – Optimal for Market and Competitor Analysis
#Market and Competitor Analysis #Graph #Competitor Analysis
-

Market Analysis Graph Ahead of the Future – Innovative Business Insights
#Market and Competitor Analysis #Diagram #Graph
-

Business Partner Analysis Bar Graph – Market Insights
#Market and Competitor Analysis #Graph #Competitor Analysis
-

Space Industry Market Analysis Bar Graph – Providing Strategic Insights
#Market and Competitor Analysis #Graph #Competitor Analysis
