Business Goal Analysis Graph – Realizing Business Vision
RJ0300075_20
- Last Update 05/09/2025
- File Size 1.1MB
- # of Slides 2
- File Format PPTX
- Slide Ratio 16:9
- Color
Keywords
- #Content-Based Slides
- #Design-Based Slides
- #Business Vision and Strategy
- #Market and Competitor Analysis
- #Diagram
- #Graph
- #Other
- #Business Goals
- #Market Analysis
- #Column
- #Segmented Column
- #Mockup
- #16:9
- #stacked column chart PowerPoint
- #business goal analysis slide
- #data visualization template
- #performance trend chart
- #how to create stacked bar chart in PowerPoint
About the Product
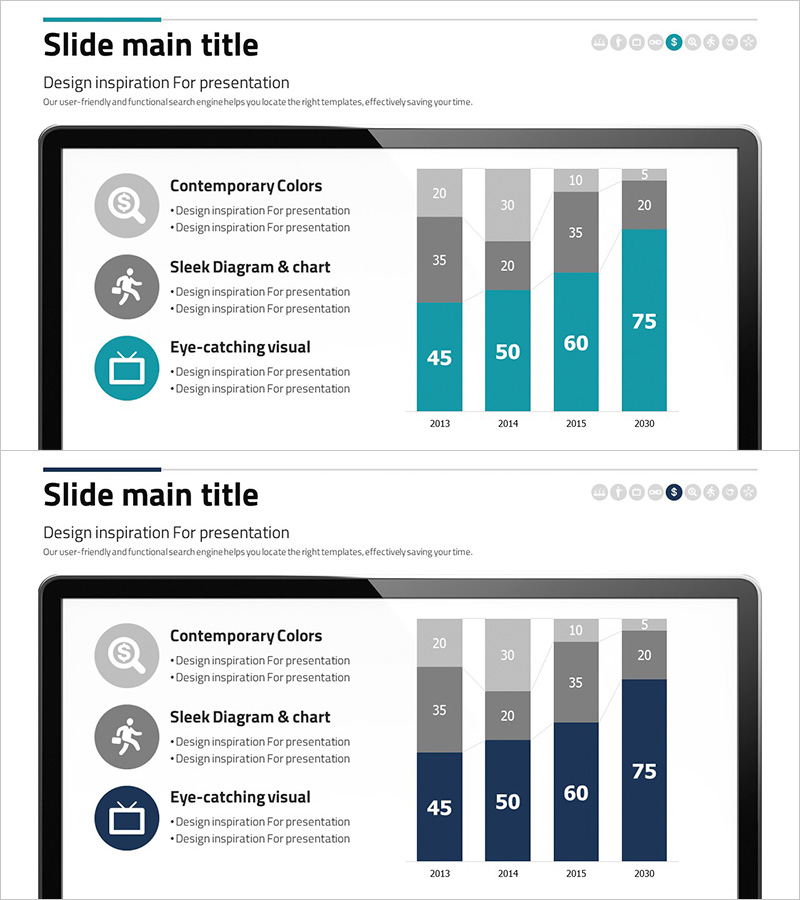
A stacked column chart PowerPoint slide that visualizes business goal achievement across four years (2013–2030) with three data series. The design combines teal and gray tones to emphasize key metrics, with three circular icons on the left (finance, workforce, visualization) and supporting text that outline core business strategy elements. Ideal for executive presentations, annual reports, and business plans to communicate performance trends and goal attainment clearly. The 16:9 widescreen format includes two fully editable slides ready for immediate use.
Usage Points
-
Main Usage
Compares multi-dimensional business metrics (revenue, cost, profit) across years or quarters in a single visual. Commonly used in executive dashboards, business plans, and investor pitch decks to demonstrate performance trends and goal progress over time.
-
How to Use
Replace the three circular icons on the left with your key business elements (capital, talent, technology, etc.) and update the chart data values with actual figures. Colors, number of series, and year range are fully customizable; adjust title and legend to match your presentation context.
-
Recommended For
Executives, business managers, marketing strategists, and financial analysts presenting quarterly or annual performance trends to leadership, investors, and stakeholders. Particularly effective for comparing target vs. actual results and visualizing multi-department growth simultaneously.
-
Slide Structure
Slide 1: Title area + three left-aligned circular icons with text labels + stacked column chart (4 years × 3 data series, Y-axis 0–75). Slide 2: Identical layout with navy color variant. X-axis: years (2013, 2014, 2015, 2030); legend: three series.
Related Products
-

Arctic Business Market Analysis Chart by Year – Visualizing Business Goals
#Business Vision and Strategy #Market and Competitor Analysis #Diagram
-

Business Finance Management Structure Slide – Vision and Strategy
#Company Introduction #Business Vision and Strategy #Diagram
-

Table Design for Information Transfer – Emphasizing Visual Appeal
#Business Vision and Strategy #Market and Competitor Analysis #Diagram
-

Big Data Market Analysis Graph – Trends and Performance
#Market and Competitor Analysis #Financial Plans and Performance #Diagram
