Business Income Statement Slide - Highlighting Financial Performance
RJ0300075_18
- Last Update 05/09/2025
- File Size 1MB
- # of Slides 2
- File Format PPTX
- Slide Ratio 16:9
- Color
Keywords
- #Content-Based Slides
- #Design-Based Slides
- #Financial Plans and Performance
- #Diagram
- #Income Statement
- #Sales and Revenue
- #Table
- #Standard Table
- #16:9
- #income statement PowerPoint
- #financial table presentation
- #business financial slide
- #income statement template
- #financial performance analysis PPT
- #table slide design
About the Product
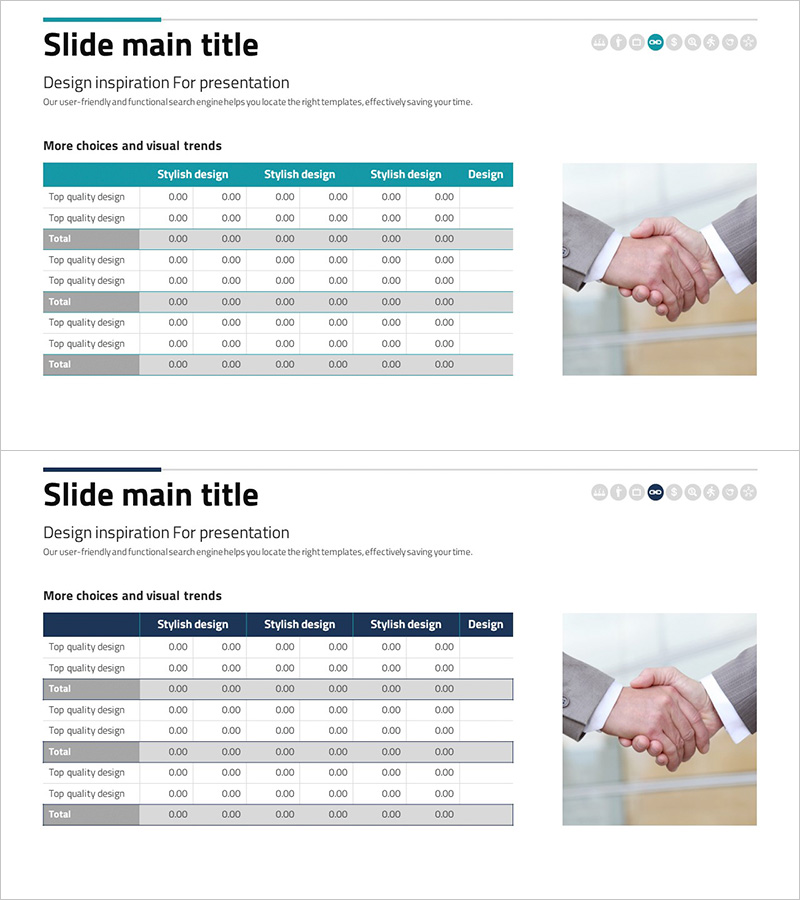
A professional income statement PowerPoint slide designed to clearly present business financial performance. The slide features a 6-column table structure with teal header and alternating gray-white rows for systematic organization of financial figures. The upper section highlights key performance metrics, while the right side displays a business partnership image to enhance credibility. With 2-slide layout, you can compare and analyze diverse financial data at a glance. Provided in fully editable PPTX format for immediate customization.
Usage Points
-
Main Usage
The primary objective is to visually organize and clearly communicate financial performance data and income statement figures to executives, investors, and stakeholders. Ideal for comparing quarterly or annual financial metrics and analyzing budget versus actual performance.
-
How to Use
Apply this slide in business plans, investor pitch decks, financial reports, and management analysis presentations within the financial statement section. Input actual financial figures into table rows and columns, and adjust colors as needed to highlight key items. The 2-slide layout allows comparison of multiple periods' data.
-
Recommended For
Recommended for CFOs, finance managers, executives, investor relations specialists, and accounting teams presenting financial performance. Suitable for earnings announcements, investor conferences, internal management meetings, and bank loan applications where credible financial data visualization is essential.
-
Slide Structure
Each slide consists of a title area at the top and a 6-column table below. The table includes a header row with teal background and data rows with alternating gray and white backgrounds, containing three sections: top-level items, mid-level items, and totals. A business partnership image on the right side provides visual balance.
Related Products
-

Business Sales and Profit Calculation Table – Essential Slide for Financial Planning
#Financial Plans and Performance #Diagram #Income Statement
-

Business Income Statement Table – An Essential Tool for Performance Analysis
#Financial Plans and Performance #Diagram #Income Statement
-

Bank Income Statement – Visualizing Financial Performance
#Financial Plans and Performance #Diagram #Income Statement
-

Visualizing Projected Income, Expenses, and Key Metrics by Business
#Financial Plans and Performance #Diagram #Text Box
