Business Process Step Diagram – Visualizing Business Strategies
RJ0300075_16
- Last Update 05/09/2025
- File Size 0.8MB
- # of Slides 2
- File Format PPTX
- Slide Ratio 16:9
- Color
Keywords
- #Content-Based Slides
- #Design-Based Slides
- #Product/Service Introduction
- #Business Strategy
- #Diagram
- #Development Status
- #Step-by-Step Schedule Plan
- #Structure
- #Pyramid Chart
- #16:9
- #step diagram PowerPoint
- #business process flow slide
- #5-stage process visualization
- #project milestone diagram
- #how to create process flow in PowerPoint
About the Product
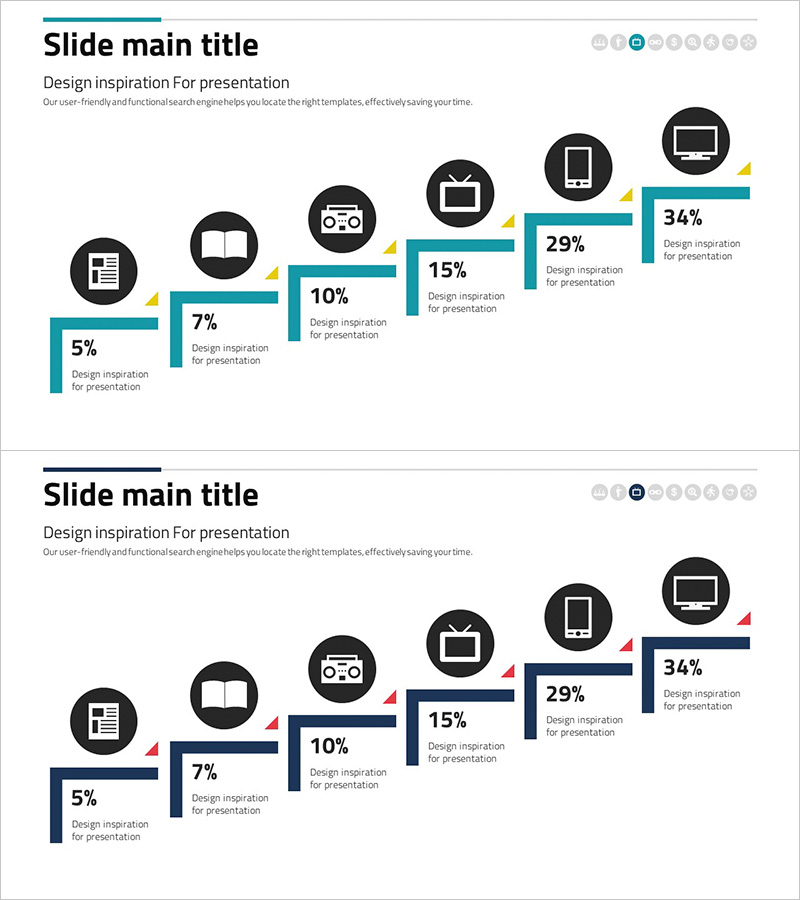
A PowerPoint slide that visualizes business processes through a 5-stage step diagram structure. Each stage features icons and numerical data to clearly express the progress of business strategies and project implementation. The contrast between teal-colored step bars and black circular icons emphasizes information hierarchy, while the left-to-right linear flow effectively communicates sequential process progression. Two color versions (teal and navy) are provided to match your presentation tone. Fully editable PPTX format with 2 slides.
Usage Points
-
Main Usage
Express business process stages through a step diagram structure to clearly communicate sequential project progression and strategy implementation. Numerical indicators for each stage show progress rates, achievements, and targets, enabling stakeholders to understand project status at a glance.
-
How to Use
Use in business plans, strategy reports, and project status presentations to explain phase-by-phase implementation plans. Customize stage icons for different business functions (marketing, development, sales, operations). Update numerical data to reflect actual project progress and real-time status.
-
Recommended For
Project managers, business planning teams, and executives presenting business strategy progress. Ideal for visualizing milestones in long-term projects such as new business launches, organizational restructuring, and system implementations.
-
Slide Structure
2-slide set featuring teal and navy step diagram versions. Each slide contains 5 nodes (stages) arranged in left-to-right linear progression. Each stage includes a black circular icon, numerical data field, and text description area for customization.
Related Products
-

Medical Step-by-Step Schedule Plan Slide – Systematic Approach
#Business Strategy #Diagram #Step-by-Step Schedule Plan
-

Smartwatch Product Technology and Development Status – Innovation and Advancement
#Product/Service Introduction #Business Introduction #Diagram
-

Milky Way Theme Business Goals Diagram
#Business Vision and Strategy #Business Strategy #Diagram
-

Composition Stairs 3D Diagram – Business Strategy and Planning
#Product/Service Introduction #Business Strategy #Diagram
