Financial Services Business Processes – Step-by-Step Strategy
RJ0300075_6
- Last Update 05/09/2025
- File Size 0.8MB
- # of Slides 2
- File Format PPTX
- Slide Ratio 16:9
- Color
Keywords
- #Content-Based Slides
- #Design-Based Slides
- #Business Strategy
- #Operational Plan
- #Diagram
- #Step-by-Step Schedule Plan
- #Business Processes
- #Flow
- #Linear Flow
- #16:9
- #arrow process diagram PowerPoint
- #4-step workflow slide
- #financial services presentation
- #business process flow diagram
- #how to create process diagram in PowerPoint
About the Product
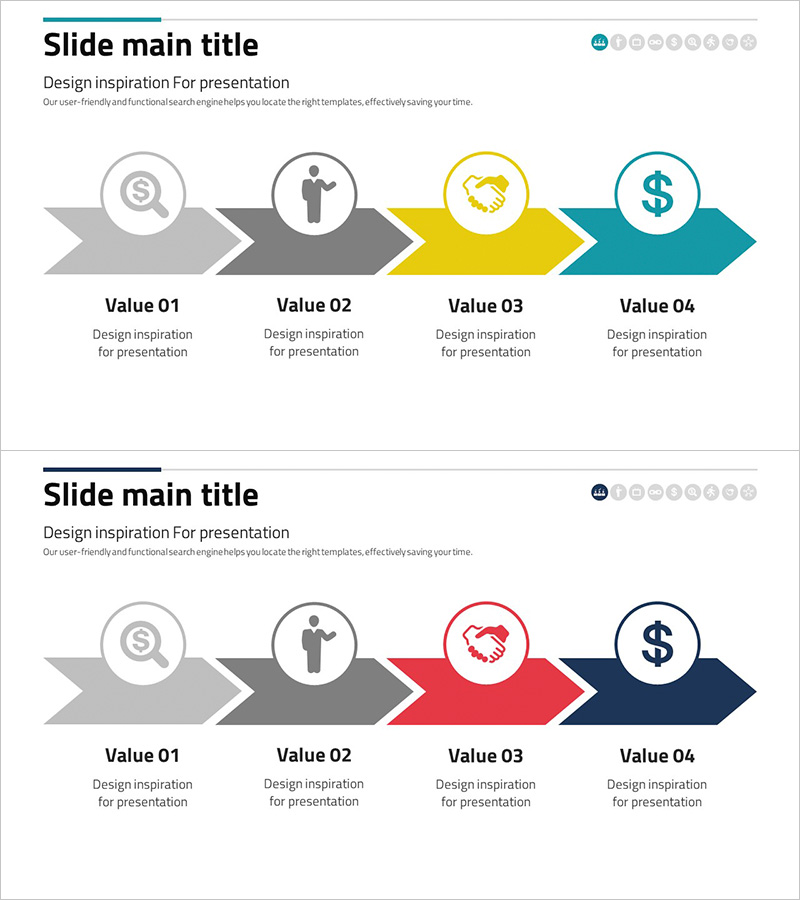
A PowerPoint slide featuring a 4-step arrow process diagram designed for financial services business workflows. The diagram uses three color combinations—gray, yellow, and teal in the first version, and gray, red, navy in the second—to highlight each stage. Circular icons (magnifying glass, person, handshake, dollar sign) represent key financial transaction elements. The 2-slide set provides flexible color options to match your presentation style and brand guidelines. Delivered in 16:9 widescreen PPTX format, fully editable and ready to use.
Usage Points
-
Main Usage
Illustrate financial services business processes, strategic initiatives, and operational workflows in a step-by-step format. The 4-stage arrow structure helps audiences grasp the complete flow intuitively. Ideal for financial reports, client proposals, and business briefings.
-
How to Use
Enter process names, responsible departments, and key activities in the text areas below each arrow. Replace circular icons with alternatives if needed to match your content. Choose between the two color versions based on your presentation tone and brand identity.
-
Recommended For
Finance, banking, and insurance professionals; business planning teams; operations managers; consultants; and financial product specialists. Suitable for internal reports, client pitches, employee training, and process improvement presentations.
-
Slide Structure
2-slide set with identical arrow structure. First slide features gray, yellow, and teal colors; second slide uses gray, red, and navy. Each slide contains 4 sequential arrow nodes flowing left to right, with circular icons and editable text labels in each node for easy customization.
Related Products
-

Visualizing Daily Work Processes – Effective Operational Planning
#Business Strategy #Operational Plan #Diagram
-

Artificial Intelligence Big Data System Process – Business Strategy Diagram
#Business Strategy #Operational Plan #Diagram
-

The Effects of Smoking on the Human Body – Infographic Diagram
#Business Strategy #Operational Plan #Diagram
-

Financial Business Process Diagram – Roadmap for Efficient Operations
#Business Strategy #Operational Plan #Diagram
