Competitor Comparison Analysis Future Outlook Graph – Competitive Advantage in the Market
RJ0300075_23
- Last Update 05/09/2025
- File Size 0.8MB
- # of Slides 2
- File Format PPTX
- Slide Ratio 16:9
- Color
Keywords
- #Content-Based Slides
- #Design-Based Slides
- #Market and Competitor Analysis
- #Graph
- #Future Outlook
- #Competitive Advantage
- #16:9
- #competitor analysis PowerPoint slide
- #competitive advantage chart PPT
- #line chart market comparison
- #business analysis graph presentation
- #how to create competitor analysis in PowerPoint
About the Product
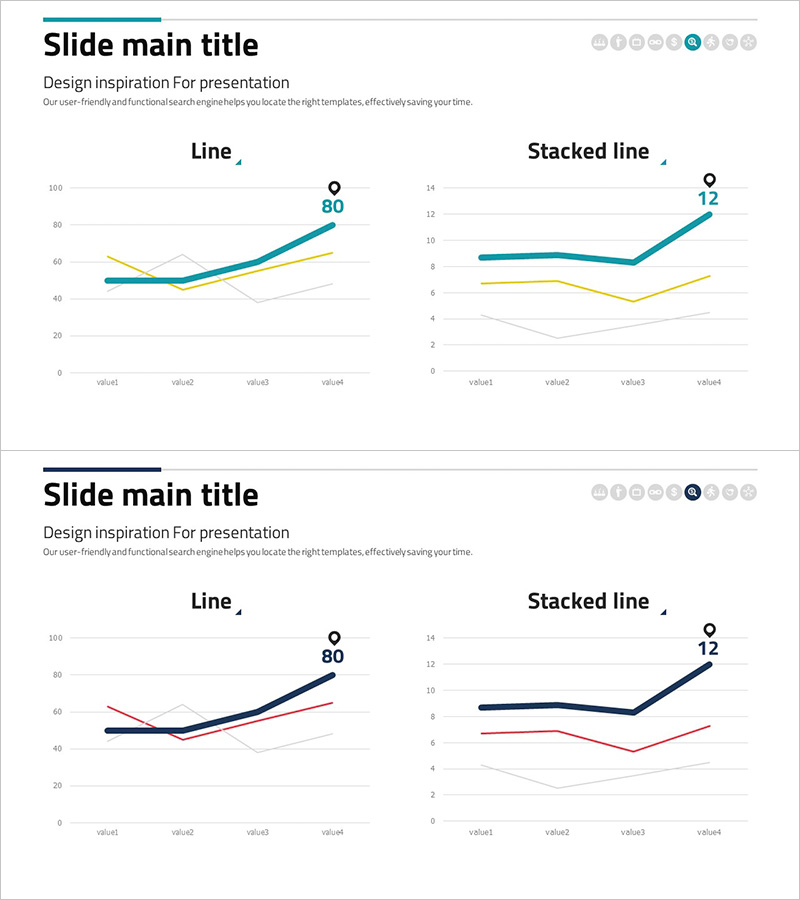
A 2-slide PowerPoint presentation designed to visualize competitive analysis and market advantage. Features both line chart and stacked line chart formats with three data series in teal, yellow, and gray to illustrate competitive positioning across four time points (value1–value4). Each slide accommodates trend data for displaying both current competitive status and future outlook simultaneously. Ready to use in investor presentations, business reports, and marketing strategy briefings within the competitive analysis section.
Usage Points
-
Main Usage
Visualize competitive performance comparison, market share trends, and future competitive outlook using quantitative data. Line charts display simple trend comparisons, while stacked line charts show market share changes relative to total market size.
-
How to Use
Insert into the competitive analysis section of investor presentations, market analysis portion of business plans, or competitive evaluation segment of marketing strategy briefings. Edit chart legends and values with your own data for immediate deployment.
-
Recommended For
Ideal for executive and investor presentations, business report preparation, marketing team competitive analysis reports, and consulting proposal development. Particularly effective for decision-making materials requiring quantitative evidence.
-
Slide Structure
Slide 1: Line chart displaying three data series across four time points showing trend progression. Slide 2: Stacked line chart showing cumulative trends and individual series changes simultaneously. Both slides include title and subtitle areas with dedicated chart zones.
Related Products
-

THE ROAD Presentation Table & Tied Vertical Bar Graph – Market and Competitor Analysis
#Market and Competitor Analysis #Diagram #Graph
-

Line Graph and Future Outlook Text – Market Analysis and Competitive Advantage
#Market and Competitor Analysis #Graph #Future Outlook
-

Flowering Period Graph – Future Outlook Analysis
#Market and Competitor Analysis #Graph #Future Outlook
-

Scatter Chart Visualizing the Future Development Direction of the Camping Business
#Market and Competitor Analysis #Graph #Future Outlook
