Business Sales and Income Analysis Table – Effective Visualization of Financial Performance
RJ0300075_25
- Last Update 05/09/2025
- File Size 1.3MB
- # of Slides 2
- File Format PPTX
- Slide Ratio 16:9
- Color
Keywords
About the Product
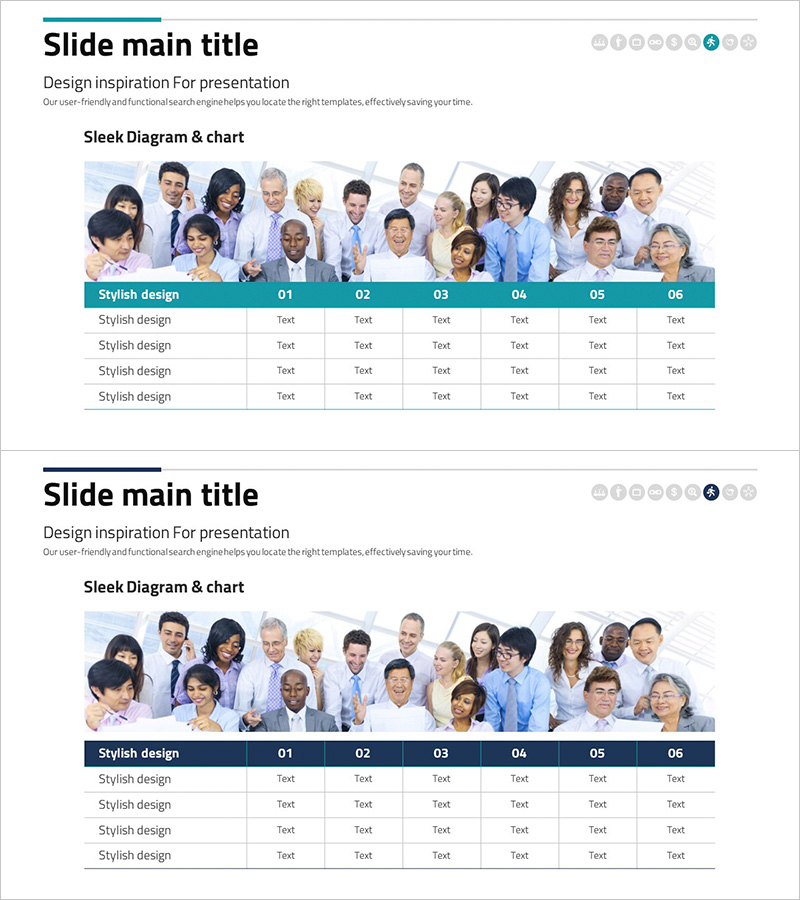
A professional sales and income analysis table PowerPoint slide designed to effectively visualize business financial performance. The 6-column comparison layout features a teal header row and light gray data rows, enabling quick assessment of quarterly, monthly, or departmental sales figures. The team photo background conveys business credibility and professionalism, while clearly defined text input areas allow immediate data entry. This PowerPoint slide set is optimized for financial reports, investor presentations, and business performance reviews.
Usage Points
-
Main Usage
Compare quarterly, monthly, or departmental sales performance and revenue trends through numerical data visualization. This slide serves as a key information delivery tool that enhances financial data readability and supports executive decision-making.
-
How to Use
Insert this slide in the financial performance section of investor presentations, annual reports, or business reviews. Enter period names or department titles in the header columns, then input corresponding figures in the data rows for instant comparison analysis.
-
Recommended For
CFOs, financial managers, business controllers, and investor relations professionals presenting financial results. Particularly valuable for public company investor relations, corporate earnings announcements, and executive management briefings.
-
Slide Structure
Teal header row with 6 column title input areas plus 4 data rows, each containing 6 cells for numerical entry. Team photo background reinforces business credibility, while clear dividing lines establish visual data hierarchy.
Related Products
-

Sales and Profit Table – Financial Performance Visualization
#Financial Plans and Performance #Diagram #Income Statement
-

Sales and Profit Table – Clear Visualization of Financial Planning
#Financial Plans and Performance #Diagram #Other
-

Sales and Bills Slide for Navigation App
#Financial Plans and Performance #Diagram #Income Statement
-

Income Statement Table – Clear Visualization of Financial Performance
#Financial Plans and Performance #Diagram #Income Statement
