Analysis of Key Target Countries Slide - Market and Competitor Analysis
RJ0300075_10
- Last Update 05/09/2025
- File Size 1.3MB
- # of Slides 2
- File Format PPTX
- Slide Ratio 16:9
- Color
Keywords
- #Content-Based Slides
- #Design-Based Slides
- #Company Introduction
- #Market and Competitor Analysis
- #Graph
- #Other
- #Global Network
- #Target Market
- #Circles
- #Doughnut Chart
- #Map
- #16:9
- #world map PowerPoint slide
- #global market analysis presentation
- #target country map
- #international business template
- #map chart slide download
About the Product
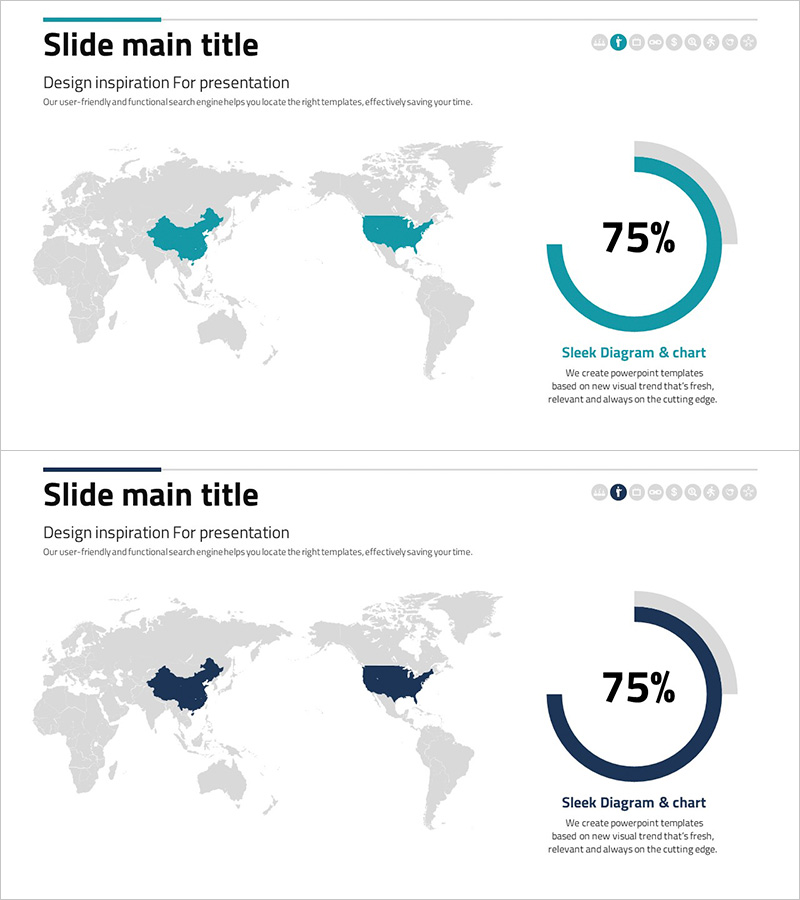
A world map PowerPoint slide designed for global market analysis and competitive research presentations. The template features a gray-toned world map with China and the United States highlighted in teal to visually emphasize key target countries. On the right side, a 75% donut chart is positioned to display market share, achievement rates, or performance metrics. The 2-slide set includes color variations (teal and navy) allowing you to match your presentation's tone and branding. Ideal for international business strategy presentations, market entry planning, investment target analysis, and global expansion discussions.
Usage Points
-
Main Usage
Visualize global market expansion strategies, international competitor analysis, and investment target selection by combining a world map with donut chart data representation. Simultaneously display geographic focus and quantitative performance metrics on a single slide.
-
How to Use
Select and highlight your target countries on the left-side world map, then adjust colors as needed. Input actual market data (market share, revenue, growth rate) into the right-side donut chart to complete your data-driven analysis. Choose between two color variations (teal or navy) to align with your presentation's brand identity.
-
Recommended For
Executive presentations on global business strategy, marketing team reports on international market analysis, investor relations (IR) materials, overseas expansion consulting proposals, international partnership project planning documents, and cross-border business development meetings.
-
Slide Structure
2-slide layout with consistent design: gray-toned world map (China and USA highlighted) on the left + 75% donut chart (teal or navy variant) on the right. Clear text input areas and data modification zones enable quick customization for different market scenarios.
Related Products
-

Global Target Region Distribution Graph – Visual Insights for Market Analysis
#Company Introduction #Market and Competitor Analysis #Graph
-

Target Area Status Analysis Graph – Data and Insights
#Company Introduction #Market and Competitor Analysis #Graph
-

Global Food Distribution Map – Insight into the Market
#Company Introduction #Market and Competitor Analysis #Graph
-

Global Target Country Map – Market Entry Strategy
#Company Introduction #Market and Competitor Analysis #Other
