Pie Chart for Market Share Analysis – Effective Data Visualization
RJ0300075_5
- Last Update 05/09/2025
- File Size 0.8MB
- # of Slides 2
- File Format PPTX
- Slide Ratio 16:9
- Color
Keywords
- #Content-Based Slides
- #Design-Based Slides
- #Product/Service Introduction
- #Market and Competitor Analysis
- #Graph
- #Development Status
- #Market Share
- #Circles
- #Pie Chart
- #16:9
- #pie chart PowerPoint slide
- #market share analysis template
- #data visualization slides
- #percentage comparison chart
- #business presentation template
About the Product
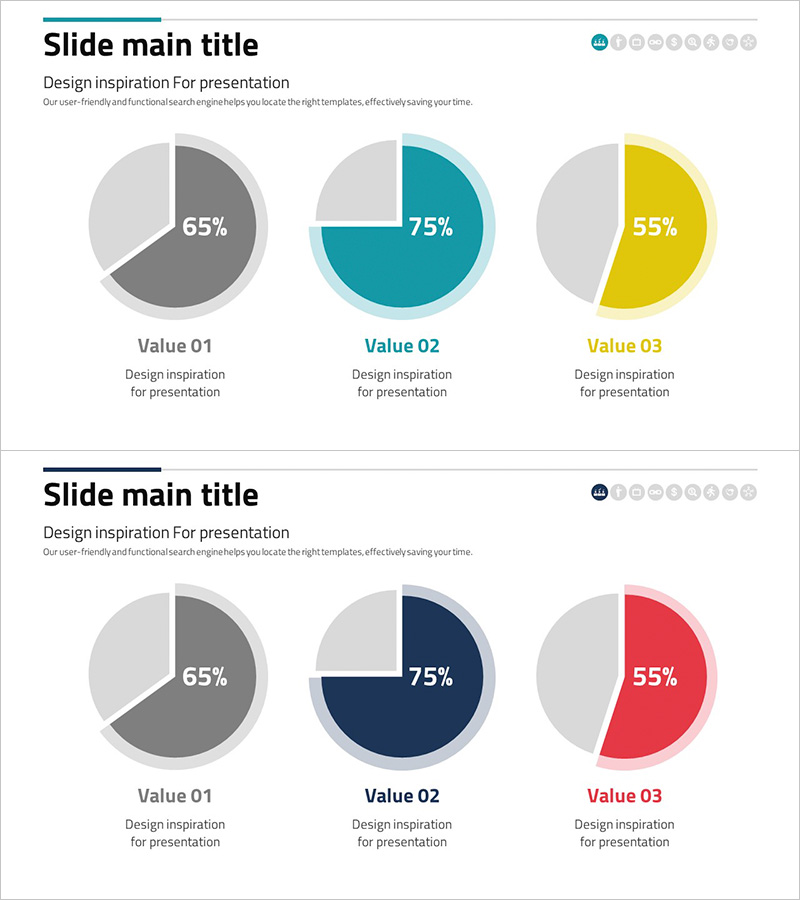
A professional PowerPoint slide set featuring three pie charts to visualize market share, product analysis, and sales ratio data. The 2-slide deck uses teal, gray, and yellow color schemes with clear percentage labels and legends for each segment. Ideal for business presentations, marketing reports, and financial analysis, this PPTX template allows instant customization of data values and labels. Perfect for executives, analysts, and marketing professionals who need to communicate quantitative insights effectively.
Usage Points
-
Main Usage
Effectively communicate three categories of quantitative data—market share, product sales ratio, or customer segment distribution—using pie chart visualization. Each chart displays percentage values and labels, enabling audiences to quickly grasp comparative data insights without additional explanation.
-
How to Use
Insert into executive reports, marketing strategy decks, or business analysis presentations during market analysis, competitive positioning, or revenue breakdown sections. Edit chart values, segment labels, and colors directly in PowerPoint to match your actual data. Suitable for investor pitches, board meetings, and client presentations.
-
Recommended For
Marketing managers, sales directors, business analysts, management consultants, financial professionals, and executives presenting quarterly results, market research findings, or product performance metrics to stakeholders and investors.
-
Slide Structure
2-slide template. Slide 1 features three pie charts in gray, dark gray, and light gray tones (showing 65%, 75%, 55% segments). Slide 2 repeats the layout with teal, navy blue, and red color variants. Each chart includes 'Value 01–03' labels with descriptive text areas below for customization.
Related Products
-

Pie Chart for Learning Progress – Optimizing Data Visualization
#Product/Service Introduction #Market and Competitor Analysis #Graph
-

Securities Business Analysis Circle Graph
#Product/Service Introduction #Market and Competitor Analysis #Graph
-

Pie Chart of the Development Status of the Snow Mountain Theme
#Product/Service Introduction #Market and Competitor Analysis #Diagram
-

Space Illustration Theme Circle Graph
#Product/Service Introduction #Market and Competitor Analysis #Graph
