Chemical Experiment Research Analysis Diagram – Innovation and Progress
RJ0700008_6
- Last Update 07/23/2025
- File Size 1.2MB
- # of Slides 2
- File Format PPTX
- Slide Ratio 16:9
- Color
Keywords
- #Content-Based Slides
- #Design-Based Slides
- #Company Introduction
- #Product/Service Introduction
- #Diagram
- #Graph
- #Other
- #Business Areas
- #Development Status
- #Cluster
- #Chain Diagram
- #16:9
- #connection diagram PowerPoint
- #4-stage analysis slide
- #ratio visualization PowerPoint
- #diagram slide template
- #step-by-step process diagram
About the Product
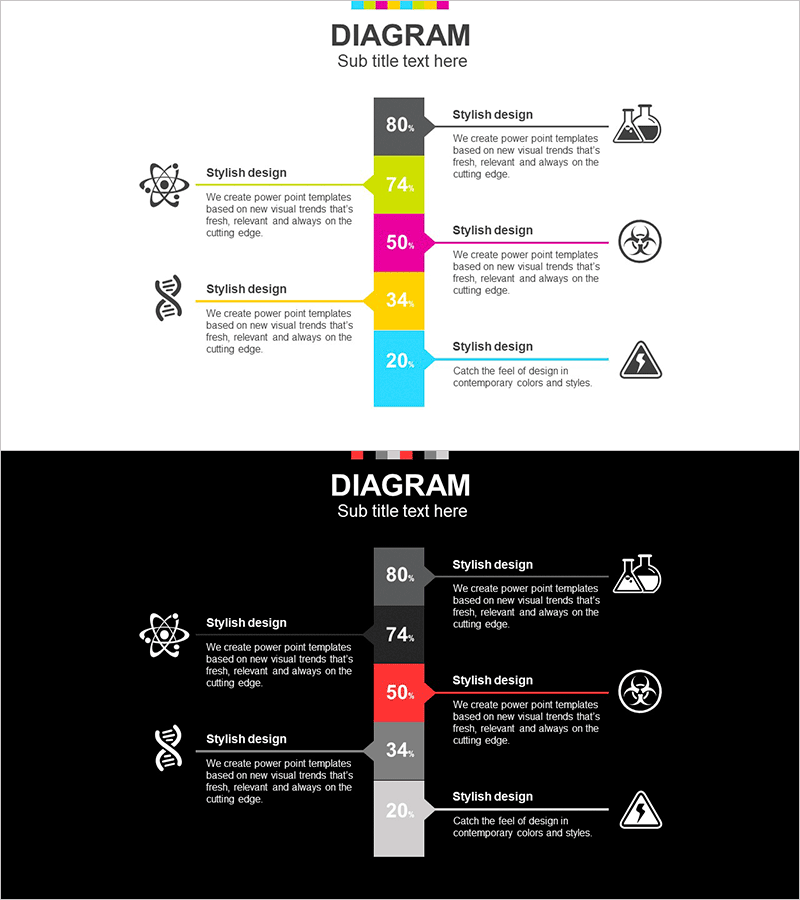
A 4-stage connection diagram PowerPoint slide that links left-side icons with right-side data visualization. Features vibrant color blocks in yellow, pink, blue, and gray with percentage values to illustrate ratio analysis and step-by-step progress. Each stage includes an icon and descriptive text for clear information delivery. Ideal for chemical research, R&D presentations, business analysis, and project status reports. Ready-to-use presentation slide template for immediate deployment.
Usage Points
-
Main Usage
Visualize research development, business analysis, and project progress in four sequential stages while clearly expressing the ratio, importance, and contribution of each stage using percentage values.
-
How to Use
Input stage topics in the left icon area and replace the percentage values in the right color blocks with actual data. Effective for expressing chemical experiment results, research achievements, and business field progress rates.
-
Recommended For
Recommended for R&D teams, technical departments, business planning teams, and marketing departments presenting project status, analysis results, and ratio data. Suitable for academic presentations, corporate reports, and investor briefings.
-
Slide Structure
2-slide set. Top title area with 4 left-side icons (atom, DNA, hazard symbol, lab equipment) and 4 right-side color blocks (gray 80%, yellow 74%, pink 50%, cyan 20%) with descriptive text areas adjacent to each block.
Related Products
-

Current Status of Financial Services System Slide – Data and Insights
#Product/Service Introduction #Business Vision and Strategy #Diagram
-

Competitive Advantage Analysis Diagram – Drive to Market Success
#Product/Service Introduction #Market and Competitor Analysis #Diagram
-

User Analysis Status by Year – Growth and Change
#Product/Service Introduction #Market and Competitor Analysis #Graph
-

Medical Research Progress Diagram – Innovation and Development
#Product/Service Introduction #Business Introduction #Diagram
