Chemical Experiment Analysis Circle Graph – Effective Data Visualization
RJ0700008_16
- Last Update 07/23/2025
- File Size 1.9MB
- # of Slides 2
- File Format PPTX
- Slide Ratio 16:9
- Color
Keywords
About the Product
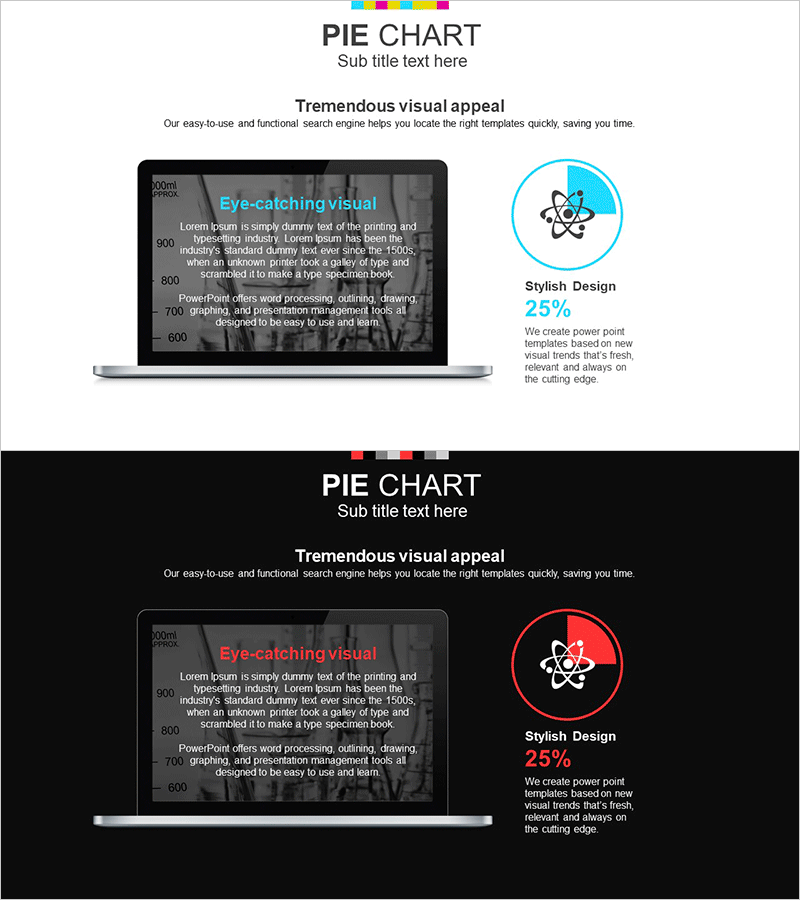
A professional pie chart PowerPoint slide optimized for chemical experiment analysis and data visualization. This template features two versions with light and dark backgrounds, each containing a single pie chart paired with an icon-based description area. The design uses cyan accent colors and neutral gray tones to convey scientific credibility, with percentage labels and text input fields ready for immediate data integration. Formatted in 16:9 widescreen PPTX, it ensures compatibility across all presentation environments and devices.
Usage Points
-
Main Usage
Visualize experimental composition ratios, component concentrations, reaction yields, and other percentage-based data using pie chart format. Ideal for chemistry, biology, and physics experiment presentations, research reports, and academic seminars to communicate complex numerical data intuitively.
-
How to Use
Input actual percentage data into the pie chart area on each slide and add item names and descriptions in the right-side text box. Use the light background version for projector presentations and the dark background version for online meetings or recorded sessions.
-
Recommended For
Chemistry researchers, graduate students, laboratory managers, science educators, and academic presenters. Suitable for experiment result analysis, data-driven reporting, thesis presentations, and conference poster sessions.
-
Slide Structure
Two-slide layout: Slide 1 features a light background (white/light gray) with one cyan-accented pie chart and right-side icon/text area; Slide 2 mirrors the structure on a dark background (dark gray/black). Each chart contains 4–5 segmented sections with percentage labels and legend input spaces.
Related Products
-

Plastic Surgery Data Analysis Donut Pie Chart Slide
#Product/Service Introduction #Graph #Other
-

Competitive Advantage Analysis Silhouette Graph – Market and Competitor Insights
#Product/Service Introduction #Market and Competitor Analysis #Graph
-

Data Status Analysis Pie Chart – Intuitive Visualization
#Product/Service Introduction #Graph #Other
-

Five Color PowerPoint Template Wide – Donut Chart
#Product/Service Introduction #Business Vision and Strategy #Graph
