Science Experiment Research Goals Diagram – Visualizing with Linear Flow
RJ0700008_28
- Last Update 07/23/2025
- File Size 1.9MB
- # of Slides 2
- File Format PPTX
- Slide Ratio 16:9
- Color
Keywords
- #Content-Based Slides
- #Design-Based Slides
- #Business Vision and Strategy
- #Business Strategy
- #Diagram
- #Business Goals
- #Step-by-Step Schedule Plan
- #Flow
- #Linear Flow
- #16:9
- #linear diagram PowerPoint
- #3-step arrow slide
- #process flow presentation
- #sequential diagram template
- #step-by-step PowerPoint slide design
About the Product
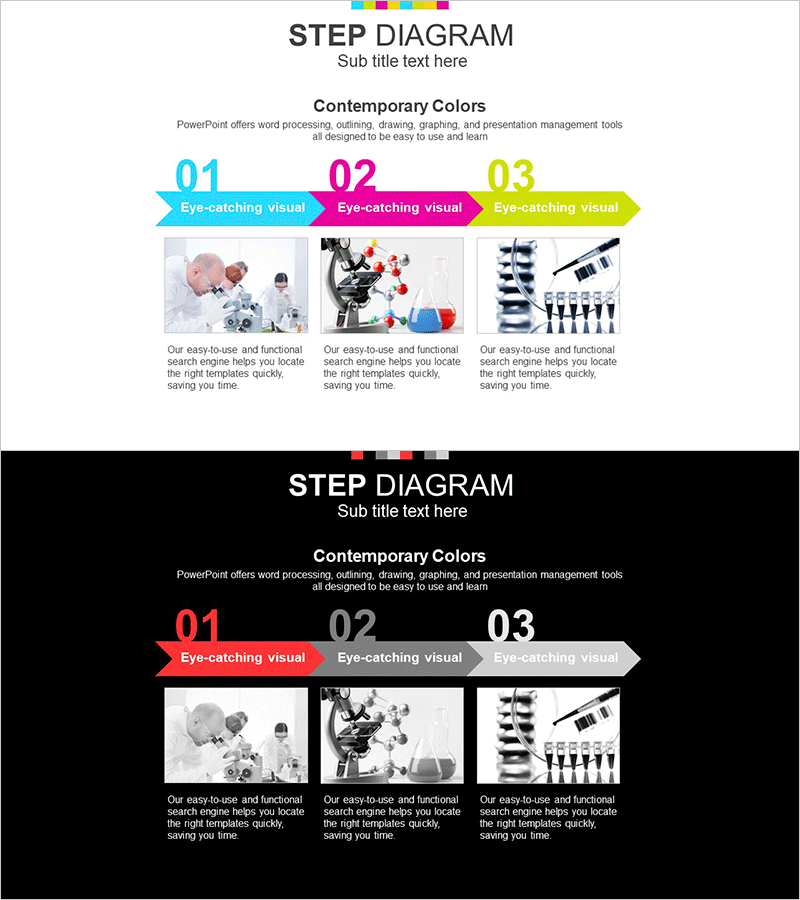
A linear flow diagram PowerPoint slide featuring three sequential steps connected by directional arrows. Two versions are provided: light background and dark background layouts. Each step includes an image placeholder area and descriptive text section, with cyan, magenta, and yellow arrow banners creating strong visual contrast. This slide design is optimized for presenting process flows, sequential goals, and research progression. Delivered in 16:9 PPTX format, fully editable and ready to customize.
Usage Points
-
Main Usage
Visualizes processes, sequential goals, and research progression in a clear left-to-right flow. Each step combines image and text areas to enhance information delivery, while the color-contrasted arrow banners clearly indicate progression direction.
-
How to Use
Use in presentation sections covering goal setting, implementation plans, and results analysis. Enter step names in the arrow banners, insert relevant photos or charts in the image areas, and add detailed descriptions in the text sections below.
-
Recommended For
Ideal for presentations on scientific experiments, research projects, business plans, marketing campaigns, and product development phases. Recommended for educational institutions, research centers, corporate planning teams, and consulting firms presenting stage-by-stage progress reports.
-
Slide Structure
Three nodes (steps) connected by left-to-right directional arrows in a linear arrangement. Each node contains a colored banner at the top (numbered 01, 02, 03), an image placeholder in the center, and a text description area at the bottom. Two layout options: light background and dark background.
Related Products
-

Science Experiment Goal Arrow Diagram – Steps for Successful Projects
#Business Introduction #Business Vision and Strategy #Business Strategy
-

Space Industry Stage-by-Stage Goals - Strategic Approach
#Business Vision and Strategy #Business Strategy #Diagram
-

Silhouette Diagram Slide – Stylish Designs for Creative Professionals
#Business Vision and Strategy #Business Strategy #Diagram
-

Step Process Diagram – Strategic Execution Roadmap Template
#Business Vision and Strategy #Business Strategy #Business Management
