White Black Area Graph – Visualizing Market Analysis
RJ0700008_13
- Last Update 07/23/2025
- File Size 1.2MB
- # of Slides 2
- File Format PPTX
- Slide Ratio 16:9
- Color
Keywords
About the Product
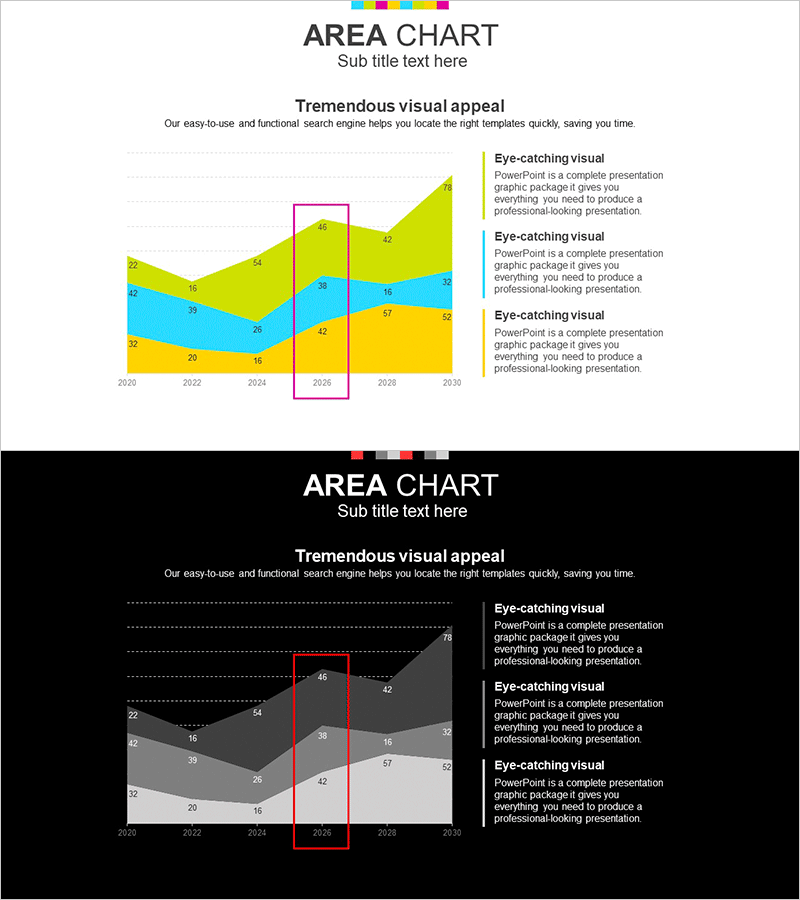
An area chart PowerPoint slide designed for market analysis and competitive comparison. Available in two versions—white background and black theme—this slide visualizes three-layer data effectively. Perfect for displaying market share trends, revenue progression, customer segment evolution, and other market indicators with visual clarity. Each area is color-coded for easy data comparison, with dedicated text description zones to communicate insights clearly. The 16:9 widescreen format includes 2 slides ready for immediate editing and presentation use.
Usage Points
-
Main Usage
Visualize market conditions, competitive positioning, and market share evolution using multi-layer data. This slide enables stakeholders to grasp complex market information—year-over-year trends, segment comparisons, and competitive landscape—at a glance.
-
How to Use
Deploy in business plans, investor pitch decks, and marketing strategy presentations within the market analysis section. Replace the sample data and legend with your actual market figures, then populate the text boxes with key insights and findings.
-
Recommended For
Executives, marketing professionals, business development teams, and investor relations specialists presenting market conditions. Especially valuable when comparing multiple data layers and supporting strategic decision-making in board meetings.
-
Slide Structure
Each slide comprises a title area, the area chart body with three color-coded layers, a legend, and four text description boxes. The white version features a bright background with vibrant chart colors; the black version uses dark background with high-contrast tones for visual impact.
Related Products
-

Graph Slide for Market and Competitor Analysis – Online Market Overview
#Market and Competitor Analysis #Diagram #Graph
-

Year Comparison 3D Line Graph – Competitor Analysis and Market Status
#Market and Competitor Analysis #Graph #Other
-

Segmented Square 3D Graph: Market & Competitive Analysis
#Market and Competitor Analysis #Graph #Other
-

Spaceship Launch Analysis Graph – Ideal for Competitor Analysis
#Market and Competitor Analysis #Diagram #Graph
