Chemical Experiment Vertical Bar Graph - Data Visualization and Analysis
RJ0700008_17
- Last Update 07/23/2025
- File Size 1.2MB
- # of Slides 2
- File Format PPTX
- Slide Ratio 16:9
- Color
Keywords
About the Product
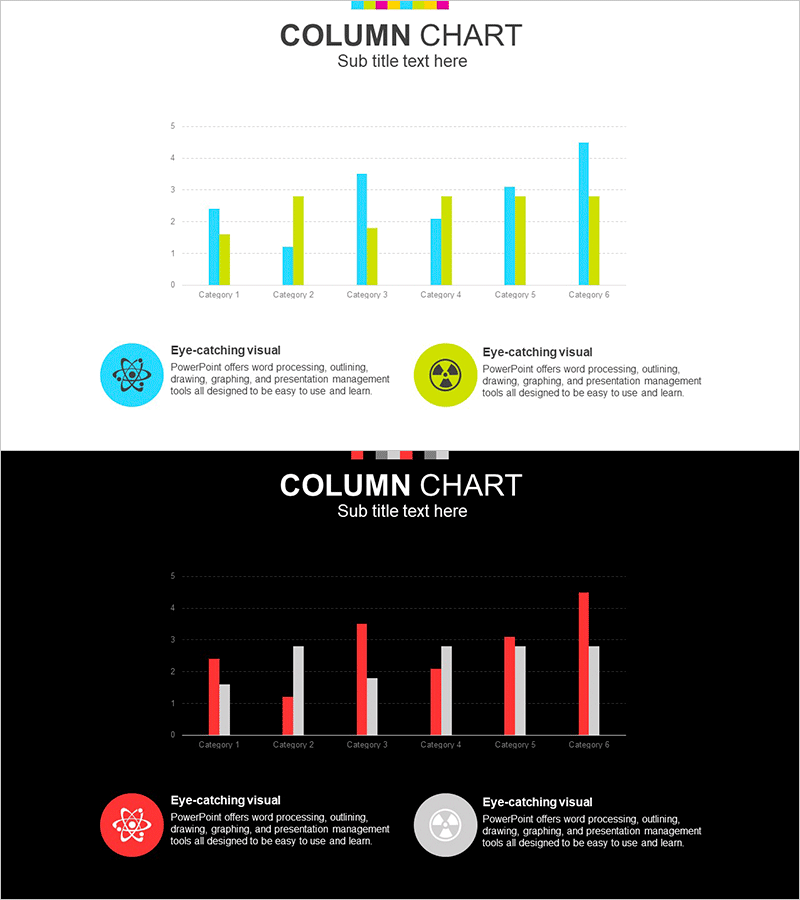
A grouped vertical bar chart PowerPoint slide designed for visualizing multi-series data across six categories. Perfect for chemical experiment results, competitive analysis, market research, and performance comparisons. This presentation slide template includes two design variations: a light gray background version and a dark background version. Each slide displays three data series side-by-side for easy category and series comparison. Fully editable in PowerPoint—simply input your values and the chart updates instantly. Ideal for business reports, academic presentations, financial analysis, and data-driven decision-making.
Usage Points
-
Main Usage
Enables side-by-side comparison of multiple data series across different categories. Ideal for presenting experimental results, competitive benchmarking, quarterly sales performance, market share analysis, and any scenario requiring multi-dimensional data visualization.
-
How to Use
Open the slide in PowerPoint and directly edit the bar heights to input your data values. Use the light background version for projector presentations and the dark background for online meetings or printed materials. Customize axis labels, legend text, and category names as needed.
-
Recommended For
Recommended for data analysis reports, executive presentations, academic research, marketing strategy meetings, financial analysis, competitive intelligence briefings, and scientific research presentations. Particularly suited for chemistry and science fields, sales team performance reviews, and consulting firm market research findings.
-
Slide Structure
Two-slide template. Slide 1 features a light gray background with cyan, yellow, and green data series. Slide 2 uses a black background with red, white, and gray series. Both slides display 6 categories (Category 1–6) on the X-axis and a 0–5 scale on the Y-axis for consistent data representation.
Related Products
-

Eco-friendly Vertical Bar Graph in Blue and Yellow
#Market and Competitor Analysis #Graph #Competitor Analysis
-

Business Bundle Bar Graph – Market Analysis and Competitive Edge
#Market and Competitor Analysis #Graph #Competitor Analysis
-

Analyzing 2 Comparison Graphs - Slides for Deriving Competitive Advantage
#Market and Competitor Analysis #Graph #Competitor Analysis
-

Earth Analysis Bundle Vertical Bar Graph – Market and Competitor Analysis
#Market and Competitor Analysis #Graph #Competitor Analysis
