White Black Double Horizontal Bar Graph – A Visual Tool for Market Analysis
RJ0700008_10
- Last Update 07/23/2025
- File Size 1.2MB
- # of Slides 2
- File Format PPTX
- Slide Ratio 16:9
- Color
Keywords
- #Content-Based Slides
- #Design-Based Slides
- #Market and Competitor Analysis
- #Graph
- #Competitor Analysis
- #Horizontal Bar
- #Double Horizontal Bar
- #16:9
- #double horizontal bar chart PowerPoint
- #comparative analysis slide template
- #market analysis graph
- #competitive analysis PPT
- #how to create bar chart in PowerPoint
About the Product
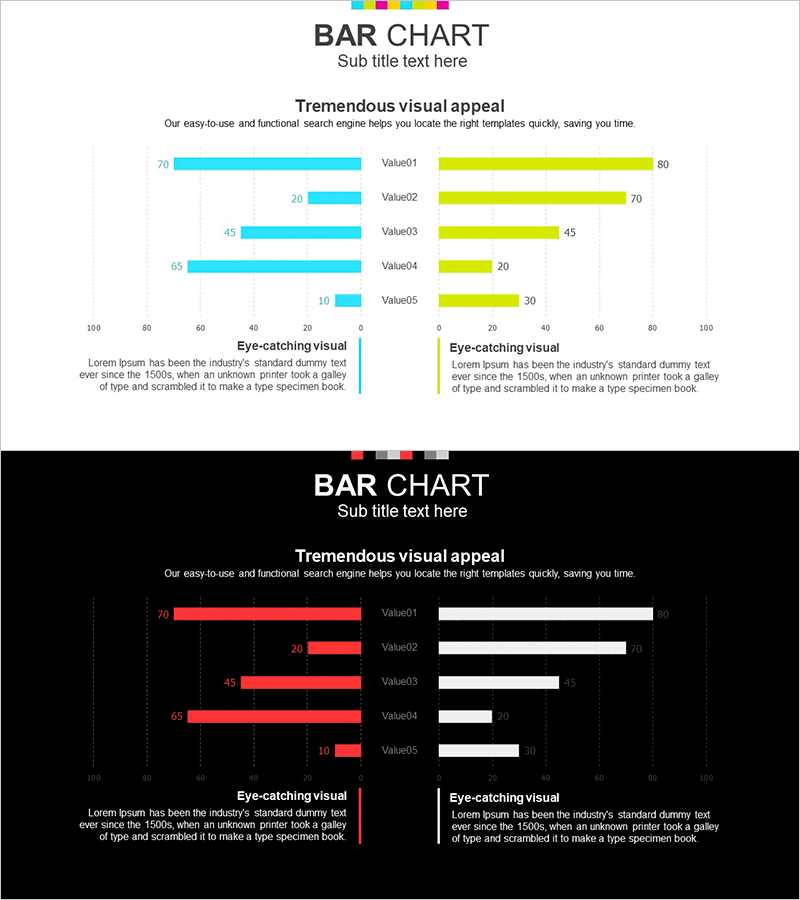
A dual-axis horizontal bar chart PowerPoint slide designed for market analysis and competitive comparison. The slide features two contrasting data series: cyan bars on the left and yellow bars on the right, enabling side-by-side comparison of five items (Value01 through Value05). Each bar is labeled with its corresponding numerical value for clarity. Two layout versions are included—one with a light background and one with a dark background—allowing you to match your presentation's visual tone. Delivered in fully editable PPTX format, the chart automatically adjusts bar lengths when you input new data values.
Usage Points
-
Main Usage
This slide visualizes two data series in a left-right comparison format, ideal for market share comparisons, competitive benchmarking, before-and-after analysis, and demographic breakdowns. The symmetrical layout makes numerical differences immediately apparent, making it highly effective for executive decision-making presentations.
-
How to Use
Use this slide in business reports' market analysis sections, investor presentations (IR materials) for competitive positioning, marketing plans for audience segmentation, sales team competitive analysis decks, and consulting firm benchmarking studies. Assign your company's data to the left bars and competitor or target metrics to the right bars for clear performance contrast.
-
Recommended For
Executive and C-suite reporting, investor relations (IR) presentations, marketing team market analysis briefings, sales team competitive intelligence decks, and consulting firm benchmark analysis reports. Suitable for any business presentation requiring quantitative side-by-side comparison.
-
Slide Structure
Two-slide set featuring identical chart layouts with different backgrounds: Slide 1 has a light background, Slide 2 features a dark background. Each slide displays five items (Value01–Value05) with cyan bars extending left and yellow bars extending right. Numerical labels appear at the end of each bar. A descriptive text area at the bottom allows you to add analytical insights or key takeaways.
Related Products
-

Car Wide Template Bilateral Bar Graph
#Market and Competitor Analysis #Graph #Competitor Analysis
-

Business Competitor Analysis Graph
#Market and Competitor Analysis #Graph #Competitor Analysis
-

Performance Competitive Comparison Analysis Chart – Business Performance Analysis
#Company Introduction #Market and Competitor Analysis #Diagram
-

Surgical Site Analysis Graph – Market and Competitive Analysis
#Market and Competitor Analysis #Graph #Competitor Analysis
