Scientific Experiment Results Analysis Graph – Visualizing Research Outcomes
RJ0700008_26
- Last Update 08/30/2025
- File Size 1.8MB
- # of Slides 2
- File Format PPTX
- Slide Ratio 16:9
- Color
Keywords
- #Content-Based Slides
- #Design-Based Slides
- #Technical Approach
- #Market and Competitor Analysis
- #Diagram
- #Graph
- #Research and Development
- #Market Analysis
- #Table
- #Circles
- #Doughnut Chart
- #16:9
- #doughnut chart PowerPoint
- #pie chart slide template
- #data ratio visualization
- #scientific experiment results PPT
- #donut chart presentation slide
About the Product
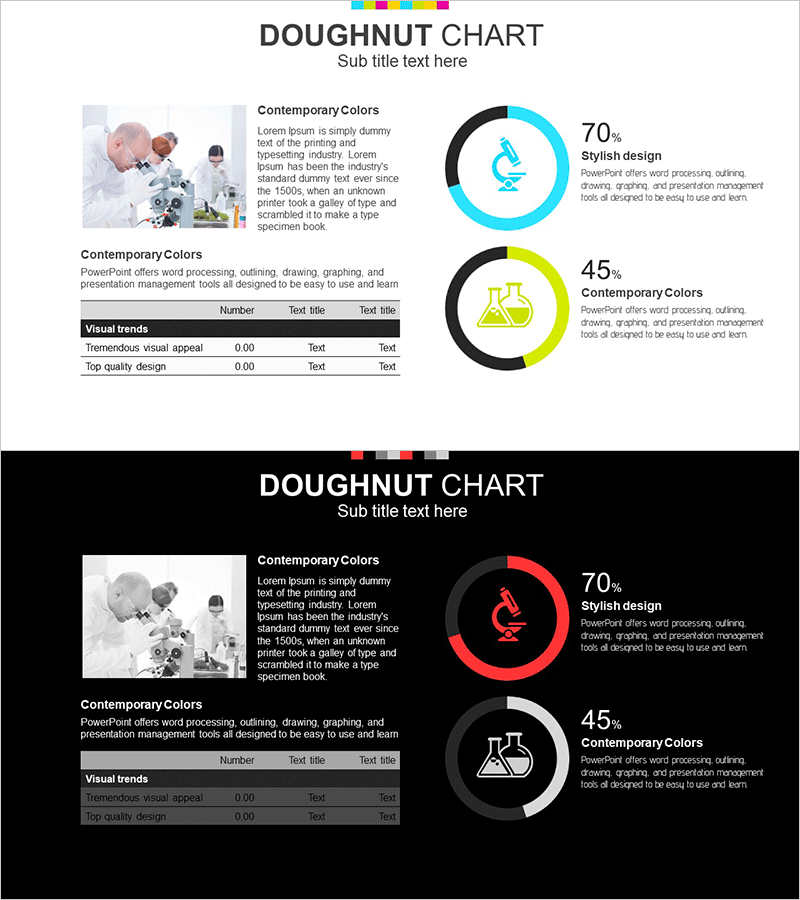
A doughnut chart PowerPoint slide designed to visualize scientific experiment results and research outcomes. This 2-slide template offers both light and dark background design options, with each slide featuring two doughnut-shaped pie charts for clear data ratio representation. Contrasting cyan and yellow color schemes distinguish each data segment, while central icons (microscope and flask) emphasize the scientific theme. Combined with data tables and text areas, this presentation slide enables simultaneous display of quantitative data and explanatory text, making it immediately applicable for research presentations, academic seminars, and technical reports.
Usage Points
-
Main Usage
Optimized for visually communicating scientific experiment results, research outcomes, and data ratio analysis. The doughnut chart intuitively represents the composition ratio of parts relative to the whole, while central icons reinforce credibility and professionalism for science and technology topics.
-
How to Use
Use in academic presentations, research reports, technical seminars, and science education materials to visualize quantitative experimental data. Light background slides suit bright classroom and conference room environments, while dark background slides are ideal for large-screen presentations in dimly lit venues.
-
Recommended For
Recommended for scientists, researchers, university instructors, technical professionals, and data analysts presenting experimental results and research achievements. Particularly valuable for academic presentations and technical reports in medical, pharmaceutical, chemical, life science, and environmental fields.
-
Slide Structure
2-slide layout. Each slide features explanatory text and data table on the left, with two doughnut-shaped pie charts (each 2-segment) on the right. Central icons (microscope and flask) inserted in doughnut centers. Cyan, yellow, and black color palette. 16:9 widescreen format, PPTX file type.
Related Products
-

Science Experiment Analysis Circle Graph Table Chart – Technological Advancement
#Product/Service Introduction #Technical Approach #Diagram
-

Observation Status Analysis Graph – Market and Competitor Analysis
#Market and Competitor Analysis #Diagram #Graph
-

Detailed Analysis in Book Illustration PowerPoint Template
#Market and Competitor Analysis #Diagram #Graph
-

Graph Charts for Systematic Market Analysis – Bar and Pie Charts
#Technical Approach #Market and Competitor Analysis #Diagram
